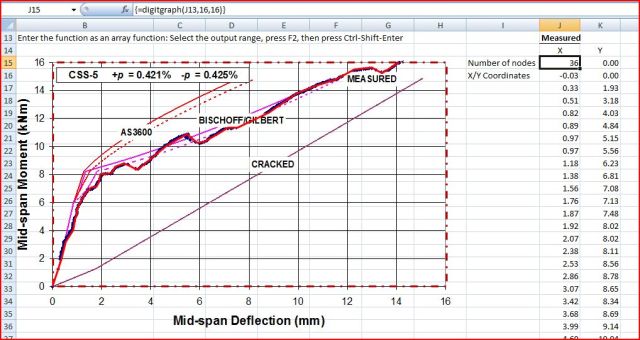
For instance, suppose we had a graph from a technical paper, and we wanted to extract numerical data from the graph lines. One way would be to measure the points by hand and calculate the numbers by scaling from the axes, but that would be inaccurate, error prone and tedious. Another way would be to scan the graph and paste it into a program that will return the screen coordinates of selected points, and scale the screen coordinates to graph coordinates. I have written a VBA program to make this procedure quick and easy: DigitGraph.xls (including full open source code).
The procedure is:
- Paste the scanned image, and drag to a convenient size.
- Select the rectangle named “Axes”:
- Drag the rectangle so the bottom left corner is at the origin.
- Stretch the top right corner so that the left and bottom edges extend to points with known ordinates.
- Draw over the lines or shapes to be digitised, using a single freeform shape for each line.
- Give the drawn shapes any unique name.
- Enter the Digitgraph function as shown below, where XLen and YLen are the true length of the X and Y axes.
- If the origin has non-zero coordinates enter Xorigin and Yorigin.
- Enter the function as an array function: Select the output range, press F2, then press Ctrl-Shift-Enter
The function arguments are: =DigitGraph(Shape Name, XLen, YLen, Xorigin, Yorigin)
The function will return a list of coordinates of the traced lines, to the scale of the X and Y axes.
Example output is shown in the screen shot below, using a scanned graph of a beam deflection experiment. The DigitGraph function results are on the right, showing the number of points in the traced polyline, followed by XY coordinates, to graph scale, for each point.


Nicely done!!! I’ve often thought about doign this, although I was going to actually capture the x/y with a mouse click, nice job Doug
Ross
LikeLike
This is very nice and handy too.
It only works with linear axes, though.
I used to mess with physics graphs in my past, and you get lots of graphs with logarithmic axes (sometimes just the X, sometimes just Y, and sometimes both)
This tool with logarithmic axes support would have been a killer back then!
Don’t get me started on trying to do this with Matlab…
Good job!
LikeLike
Good idea! See my latest post.
And good luck with your new blog!
LikeLike
Thanks a lot, I’m looking now.
LikeLike
Pingback: Digitising logarithmic scales « Newton Excel Bach, not (just) an Excel Blog
Pingback: Excel as a digitizer « Excel Tips Monster
This looks very flexible but I need an explanation of how to give a name to a shape. How did you give the name ‘measured’ to the red line?
“Give the drawn shapes any unique name (the drawn line is the red line named “measured” in the example below.)”
Nick
LikeLike
Nick – select the shape by clicking on a boundary, then type the name in the name box in the top left hand corner. When the shape is selected the name box will display the default name (something like rectangle 3). You can just type over it.
You can do the same thing to name a range by the way.
LikeLike
Doug,
Great work, thank you. I still get “artifact” point (the first one with a very large x coordinate).
George
LikeLike
I have been looking for something like the DigitGraph Function for a long time. Thank you so much for a) figuring out this elegant solution, b) for even sharing it, c) even for free. It’s just so beautiful. Thank you so much. You are my HERO!
LikeLike
Pingback: The Dome of Santa Maria del Fiore – Dimensions | Newton Excel Bach, not (just) an Excel Blog
Pingback: Daily Download 10: Excel Digitiser | Newton Excel Bach, not (just) an Excel Blog
Doug, awesome tool! As a geotechnical engineer I have to plot lots of data into graphs from several authors, which your function made a lot easier. Thank you so much for sharing this tool, keep up the good work!
LikeLike
Thanks, it’s always good to have feedback, especially when it is positive 🙂
LikeLike
Thanks for this fantastic tool. It is possible to digitize singular points instead of lines or curves?
LikeLike
I know the reply. You can put the nodes of the shape in the points you want to digitalize.
Thanks a lot for the app
LikeLike
I know the reply to my own question. You can put the nodes in the points you want to digitalize.
Thanks for the fantastic tool!
LikeLike
Glad you find it useful and thanks for the comments.
LikeLike
Pingback: DigitGraph Spreadsheet and WebPlot Digitiser | Newton Excel Bach, not (just) an Excel Blog