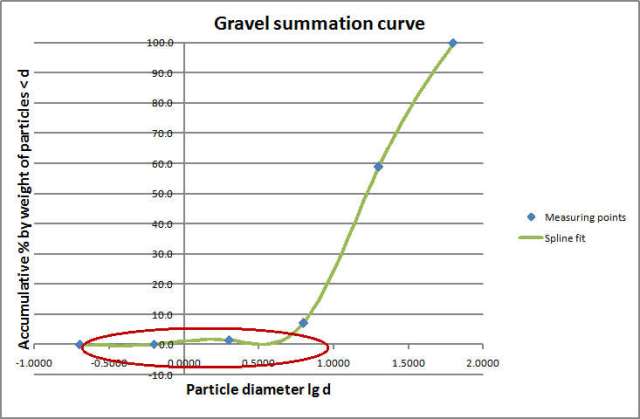
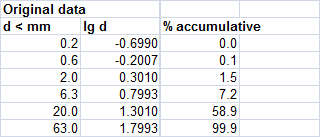
I recently had an interesting query from Georg, a geography student in Germany regarding the use of cubic splines to fit a smooth curve to experimental data. The graph he sent me is shown below:
The cubic spline has produced a nice smooth curve, but the problem is that it is supposed to be a cumulative frequency curve, and cumulative frequency curves are not supposed to slope downwards, let along pass below the zero line. Unfortunately cubic splines don’t know that, and will just adopt the shape dictated bt the given points.
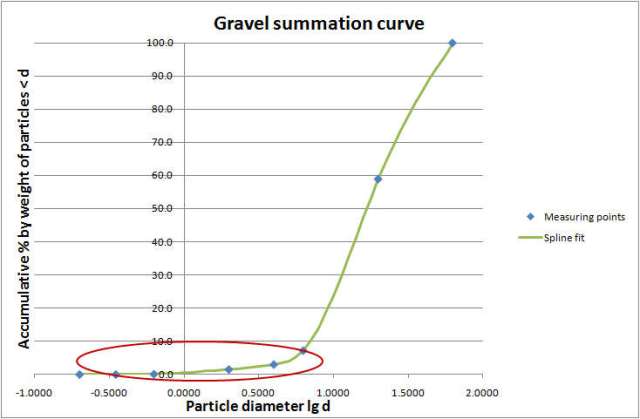
One solution is to insert additional points in the areas with problems as illustrated below:
Which gives us the result we want!


Adding points, while clearly a pragmatic approach, tickles my nit-picky nerve – there’s a distinct sense of a fudge being applied to fix a more fundamental fault.
Wouldn’t the situation be better handled by applying a curve-fitting algorithm that guaranteed the monotonicity we actually require?
How about, oh, I dunno, a monotonic cubic spline? (http://en.wikipedia.org/wiki/Monotone_cubic_interpolation)
I can’t recall actually needing one in the last 20+ years – I implemented a version (taking Sedgewick’s “Algorithms” as the reference) in COBOL in the late 80s…
Or have I completely missed the point? 🙂
LikeLike
This is the same problem that smoothed lines have in Excel. They’re done with Bexiers, not cubic splines, but Beziers don’t know any more about monotonic functions than splines.
I’m with Mike on the fix that introduces fake data points. I don’t think any good can come of it.
LikeLike
Mike and Jon – Thanks for the comments and the link (which I’ll incorporate into the CSpline function in the near future).
In defense of the method of adding additional data points, the end result is much the same as adjusting the slope of the tangents at the original data points. Also in this case the data is a cumulative frequency curve describing the grading of a sample of sand, so the data points would have considerable variation from sample to sample anyway. Certainly for other applications where the data is expected to fit a specific mathematical function it’s not a good idea to use a cubic spline to force the curve exactly through each data point.
LikeLike
Ditto Mike – Hermite splines are a standard technique for this. They introduce additional flexibility, by relaxing the assumption of continuity of curvature, and can also be much faster to plot as iterative algorithms are available.
A simple approach is to use a cardinal spline and adjust the tension so the tangent never overshoots the next point. (This is similar to the smooth line charting option except that Excel’s algorithm preserves rotational symmetry not monotinicity.)
LikeLike
Doug – I wanted to add that I posted a short piece of code for the chart curve based on the Hermite formulation some time ago: http://www.internetcomputerforum.com/forum/microsoft-excel-forum/129901-smooth-line-xy-chart.html
It would be good to apply your cubic solver for this sort of problem, I guess the results would be quite close to the method above. I’d be grateful if you could look at this sometime.
LikeLike
Pingback: Cubic Hermitic and Cardinal Splines « Newton Excel Bach, not (just) an Excel Blog
Lori – thanks for the suggestions. In my latest post I have taken some cardinal spline perl code and converted it to VBA and added the cubic solver, so you can specify points either as a position along the curve, or by X or Y values.
LikeLike
Doug – impressive stuff. Your solver should do the trick as the chart spline is just a catmull-rom with a tension adjustment (0<z<=0.5) on small intervals, so thanks! In a previous comment i argued that this will often be close to a standard cubic spline.
LikeLike
Pingback: Daily Download 22: Splines and Curves | Newton Excel Bach, not (just) an Excel Blog