
As noted in the comments on the previous post on this topic, the moving load function (and also the associated continuous beam functions) have been modified to make data entry more flexible; the output results are unchanged. The modified spreadsheet may be downloaded from ConBeamU Download, including full open-source code.
Further details of the use of the MovLoadU function are given below, with the example of a typical 3 span bridge consisting of precast concrete girders with in-situ concrete link slabs at the internal piers, and using the AS 5100 M1600 truck loading.
The definition of the 3 spans and the truck load is shown in the screen-shot below:

Definition of 3 span beam with link slabs and M1600 Vehicle
To carry out the moving load analysis:
- Define a number of vehicle positions, with the X value of axle 1 (cells H24 down in the screen shot below – click the image for a larger size view)
- For each point where the effect of the moving load is to be analysed, enter in a 2 row range the output required (one of “moment”, “shear”, “slope” or “deflection”), and the position of the point, as shown in cells I21:Q22 in the screen shot below.
- The MovLoadU function will return the selected output actions for each vehicle position listed. The function can either be used with the ranges selected in the example, or re-entered (as an array function) anywhere in the spreadsheet.
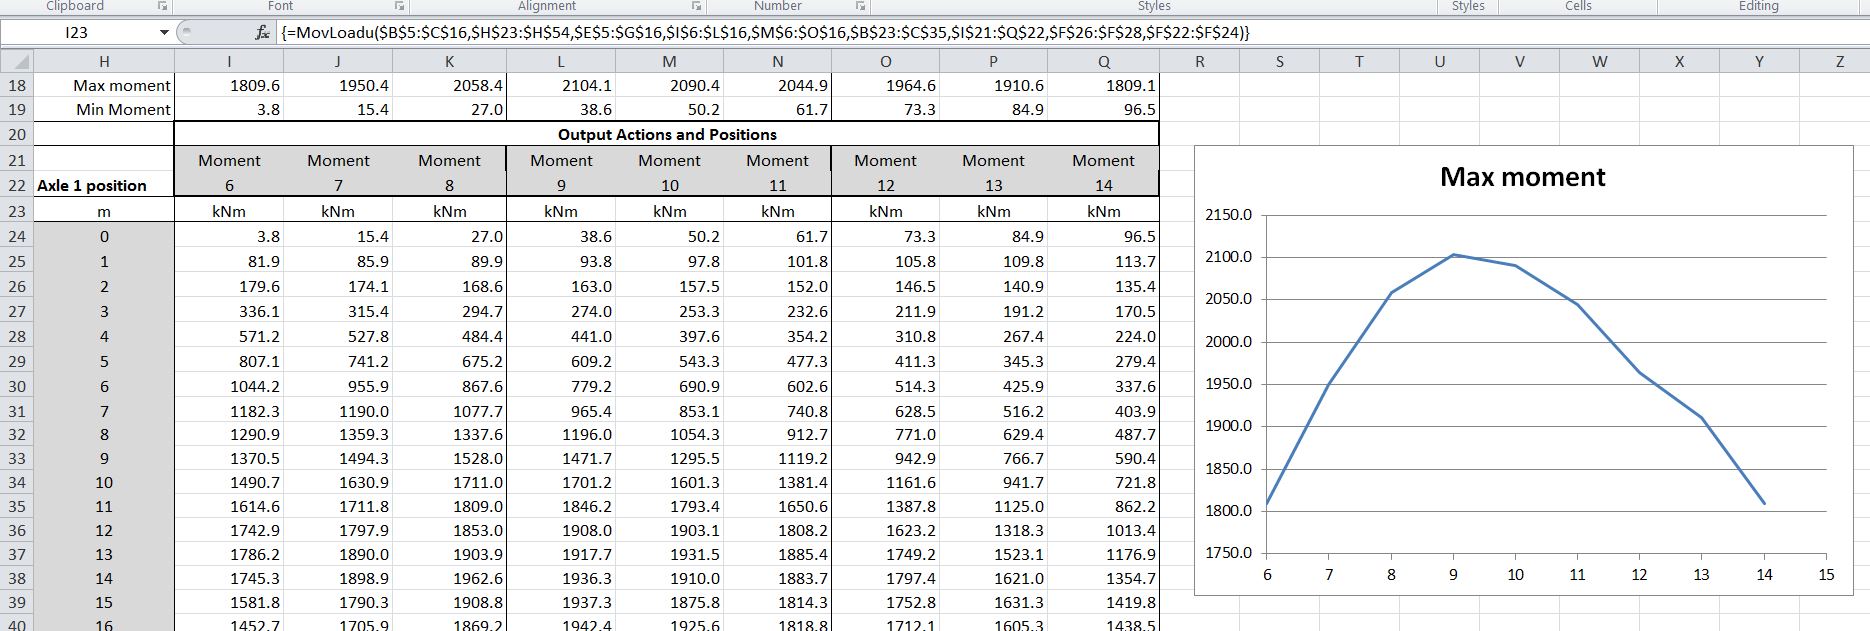
MovLoadU Output
In the screen shot above the action type (“moment”) has been entered above every output column. This may be replaced with a single entry in the left-most column, with the columns to the right of the same type being left blank:

Output action type entered in column I only
The “moment” text may also be aligned centrally over the columns to which it applies, using the “Center Across Selection” alignement:

To find the maximum bending moment in span 1 the location of the output actions, and the vehicle positions may be specified at closer centres:
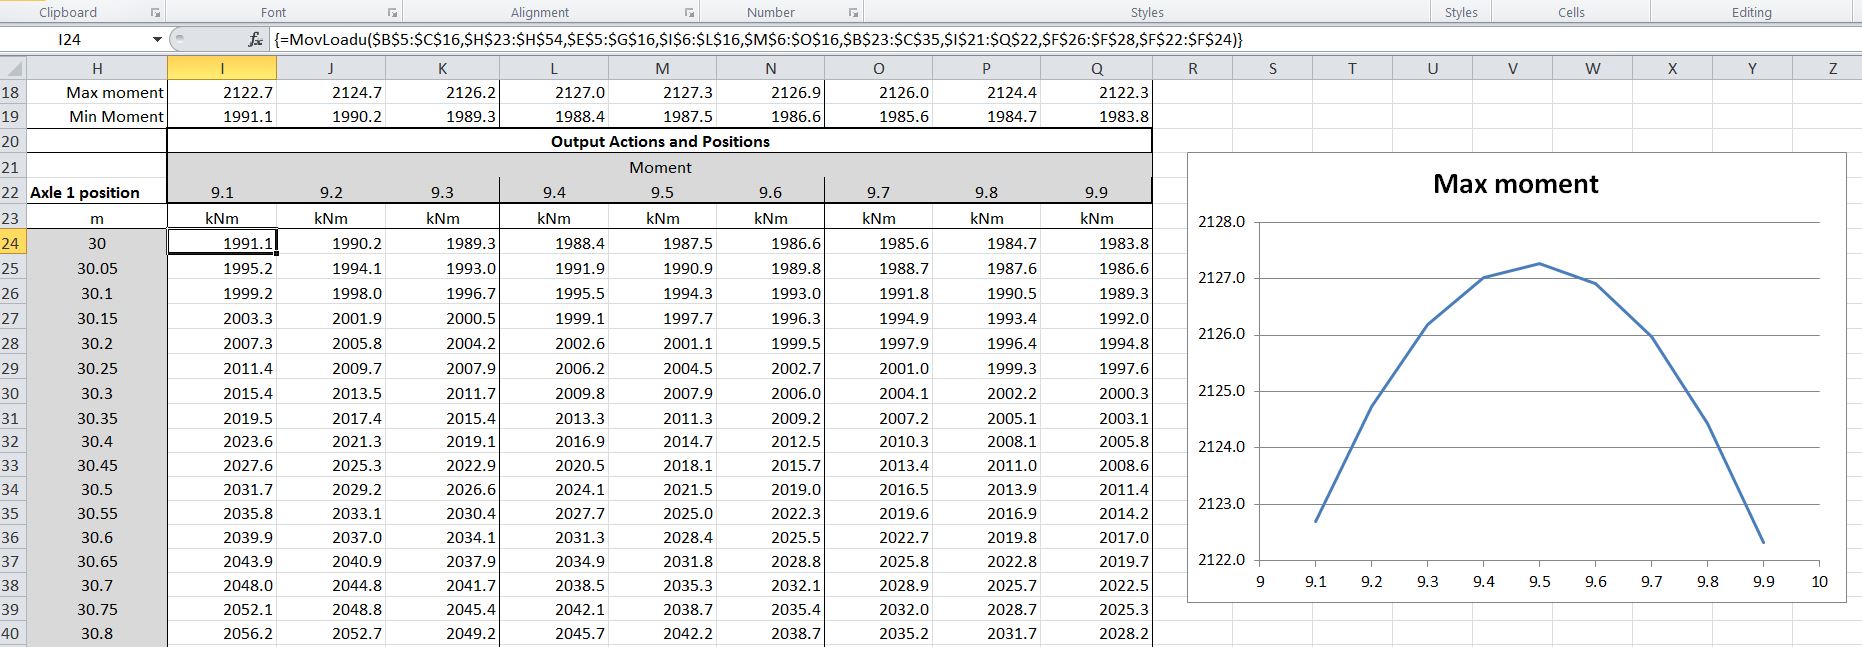
Location of maximum moment
Alternatively the Excel Solver may be used to adjust the output location to maximise or minimise the value of the selected action. In the screenshot below the Solver is set up to maximise the bending moment in the central span (cell K18) by adjusting the output location in cell K22:

Solver set-up to find maximum moment position in central span
After using the Excel Solver to locate the position of maximum moments, shears and deflections at the 9 locations shown above, the resulting output of actions and deflections can be plotted against vehicle position, as shown below:
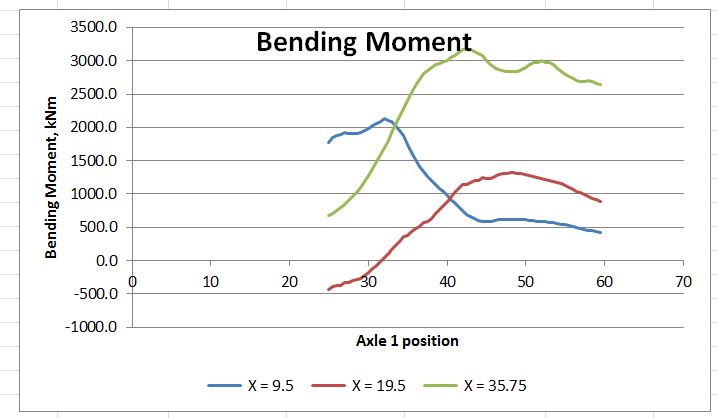
Maximum Bending Moments

Maximum Shear

Maximum Deflection

Hello,
Is it possible to output only, for example, deflection? Without Moment, shear and slope results?
Thank you
LikeLike
Hi metroxx, for the moving load function you can select whatever output you want (see examples with moment only for instance).
The output from the Conbeam is fixed at the moment, columns with Shear, moment, slope and deflection in that order. I’ll probably look at an option to make the output selectable at some time.
LikeLike
Pingback: Beam actions and deflections, 3D or 2D | Newton Excel Bach, not (just) an Excel Blog
Hi Doug,
Any idea what causes the error “This function takes no arguments”? It occurs when I enter =MovLoadU( then press the Function Wizard button.
Excel 2013 on Windows 8.1
LikeLike
Stephen – assuming you have macros enabled and you entered the name correctly, you should get all the arguments listed when you press the function wizard. Do you get a tool-tip showing MovLoadU (but no arguments) as you enter it?
If you can’t get it to work please send a copy to my gmail account (dougaj4) and I will have a look.
LikeLike
Hi dougaj4,
Thanks Heaps for sharing this. Is it possible to have the supports as pins as well? i.e. the spans as simply supported?
Appreciate your help,
LikeLike
Ario – the supports are pinned by default, but the beam is continuous over the full length. The example in the post has two supports 2 metres apart at the internal supports, connected by a flexible member representing a link slab. In the example there are still significant moments at the supports, but if you reduce the stiffness of the link slab further the main beams will in effect be simply supported.
LikeLike