
“How do you get VB6 to initialize doubles with +infinity, -infinity and NaN”… and various sorts of Not a Number.
Back in 2012 (When is an xy chart not an xy chart) I concluded that it was not possible to return an array with empty rows from a user defined function (UDF), and as a result it was not possible to generate a series with gaps in an x-y chart, using a UDF or an array function.
Recently Lori Miller has provided two solutions to this problem (see comments at the link above). First the easy way:
For users of Excel 365 there’s now an option to “show #N/A as an empty cell” under hidden and empty cell settings dialog. Right-click on a chart and select “select data”:

Click “Hidden and Empty Cells” and select “Show #N/A as an empty cell:

The XY chart will now display a break between the two values either side of the #N/A, and will retain all the features of an XY or scatter chart.
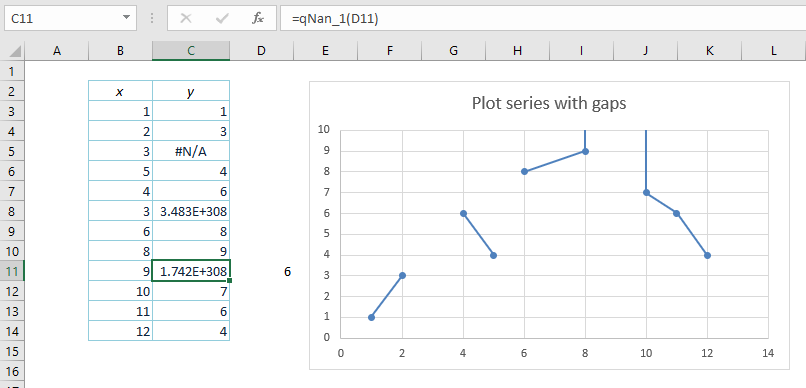
For those not using Office 365 it’s not so easy , but the spreadsheet SpecialNum.xlsb, using code from the Stackoverflow discussion at “How do you get VB6 to initialize doubles with +infinity, -infinity and NaN” (link also provided by Lori Miller) has a solution. This spreadsheet has a function returning various types of “not a number”, or NaN. Nan index 3 returns a value that is treated as a blank cell in XY charts (cell C11 below):

This value is the only one that produces the desired result. Index values 0 to 2 and 4 to 5 turn the chart into two vertical lines either side of the NaN:

Index 6 retains the rest of the chart, but has two vertical lines either side of the gap going up (presumably to infinity):
Index 7 is similar, but with the lines going downwards.

Index values 8 to 10 plot as 0:

For those interested in the details, the download file has open-source code for generating the different NaN values, and also a table listing the numbers and their features:


Surely #N/A has always worked as an apparent blank when graphing. There is no need to show it as blank, indeed showing it as blank on the page is surely unhelpful if it isn’t.
LikeLike
“Show #N/A as an empty cell” seems to be the current default behaviour, but I don’t think it was in the past. If you uncheck the checkbox, you will see that Excel will bypass the error/s with a line instead of a gap.
LikeLike
Bill – what Cameron said is my understanding. The wording in the dialogue box is confusing. The #N/A still displays on the spreadsheet, but it is treated as a blank by the chart.
LikeLike
Thanks for posting Doug. Credit for the function to return NaNs is due to the author of the linked SO post who also has some great material on hidden vba features on their profile.
For those interested in the details, there are a few clarifications needed for values shown in the sheet, both +ve and -ve (which can be verified with windows calculator):
‘Max’ (2^1024 – 2^971). Some bytes were omitted resulting in a smaller value displayed.
‘sNaN’ (3*2^1023) or more accurately ‘Ind’ or ‘Indefinite’. Signalling NaNs include values <Ind and result in an overflow exception.
‘qNaN’ (31*2^1020). Quiet NaNs include all values >=Ind.
LikeLike
Thanks Lori, I will add the Stackoverflow link to this post.
LikeLike
Pingback: XY Chart problems – 1 | Newton Excel Bach, not (just) an Excel Blog
Pingback: XY Chart problems – 2 | Newton Excel Bach, not (just) an Excel Blog