
The Python/Fortran/Excel frame analysis program (previous version here) now has several new features added to the 2D-solver routines:
- The beam bending behaviour may now be specified with moment-curvature tables, rather than the linear-plastic behaviour required in the previous version.
- Beam self weight may now be specified with a density for each material, and a gravity factor
- The analysis may now include non-linear geometric effects, as well as non-linear material properties, with the frame geometry being reconstructed after each iteration.
At the moment these features are only available in the 2D analysis; the 3D analysis works as in the previous version.
The new files may be downloaded from:
NonLin-Frame.zip
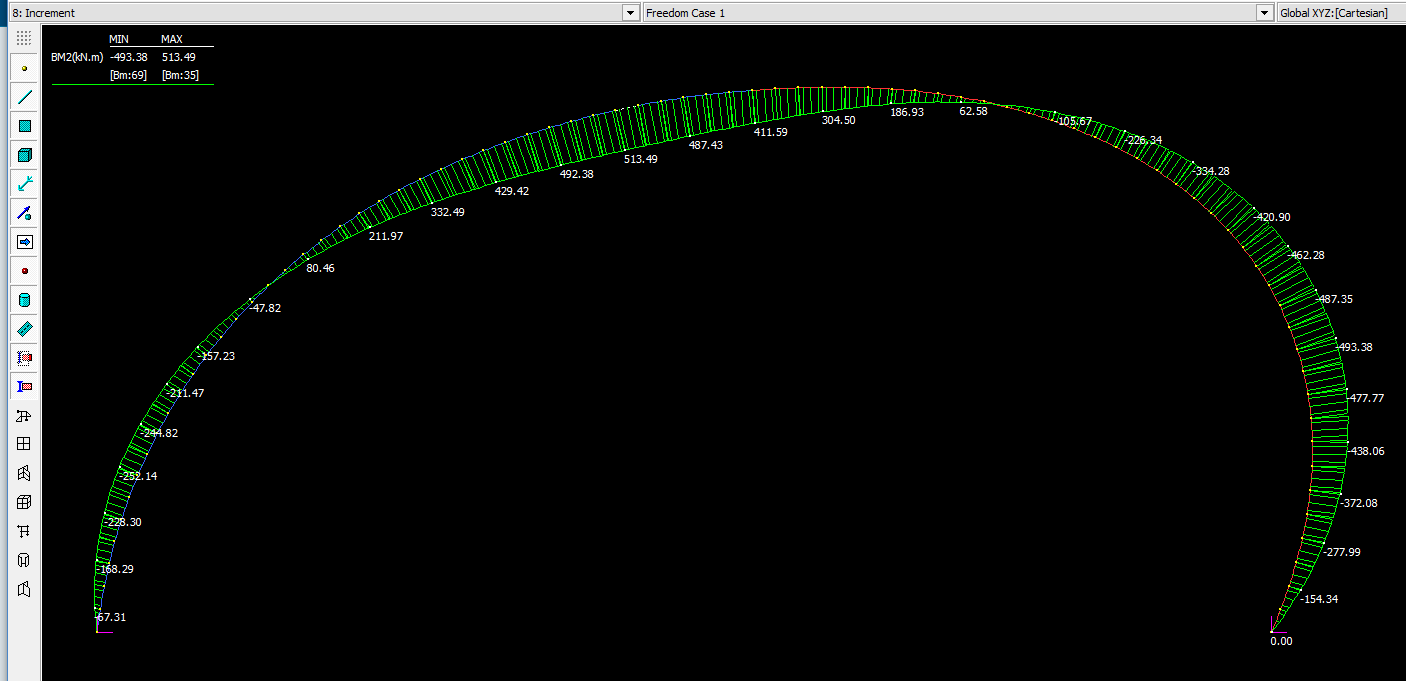
An example of the non-linear analysis of a semi-circular arch under asymmetric loading is shown in the screen-shots below:
The arch shown below was also analysed in Strand7, using the same moment-curvature tables, and with the non-linear geometry option also selected:
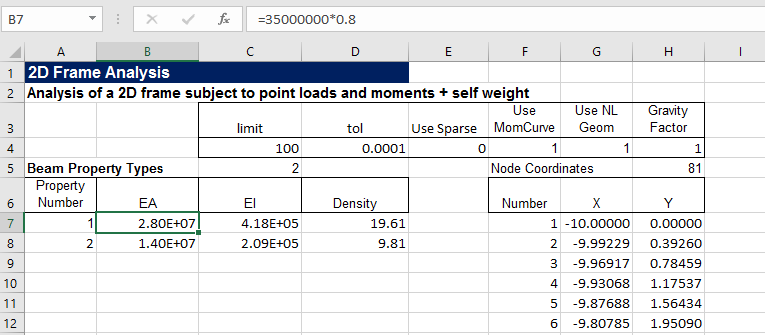
The data input is similar to the previous version, with the addition of “Use MomCurve”, “Use NL Geom” and “Gravity Factor” options, and a column for “density” in the material properties. The gravity factor should be 1 if density is in force/length units, g if density is specified as mass/length, or zero if self weight is not required.
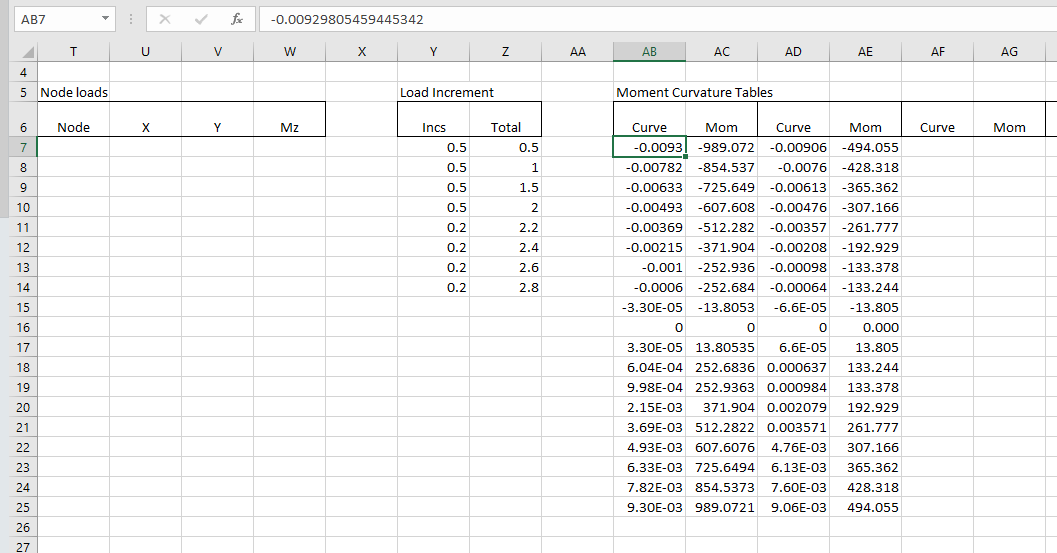
The table of node loads is still available. In this version any node loads are applied in the same increments as the self weight.
If “Use MonCurve” is activated a moment-curvature table must be entered for each material type. In the current version the moment-curvature tables are applied in sequence (from left to right) to each material type.
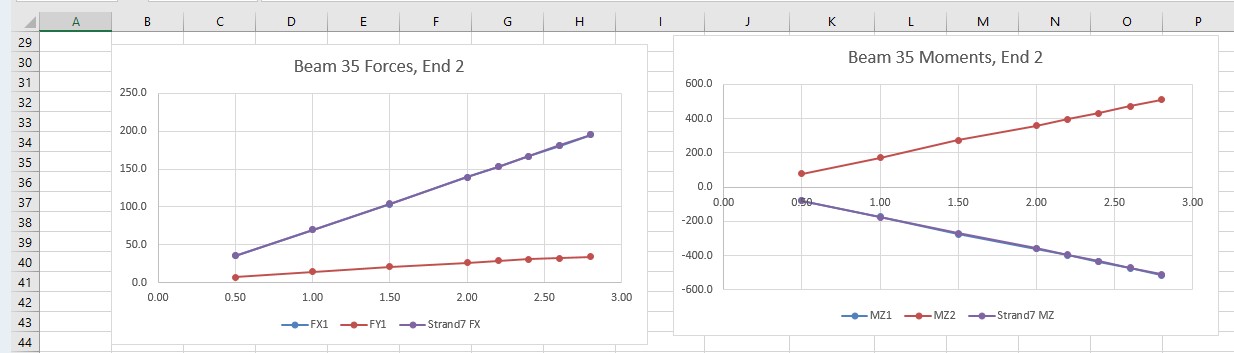
Output is similar to the previous version, with at present rudimentary options for plotting the deflection at a single node, and the forces and moments at a single beam. The screen shots below also show the Strand7 results for the same structure:
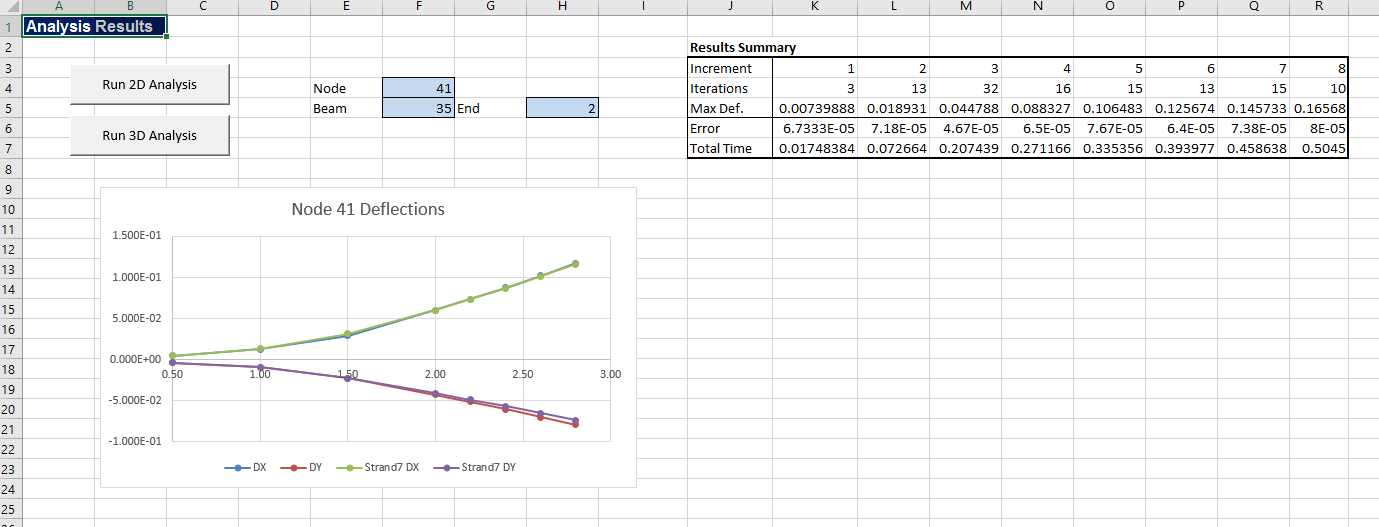
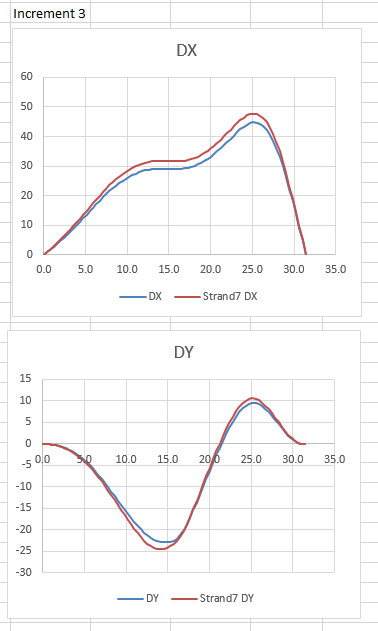
On the “Deflect” sheet graphs have been added to show X and Y deflections for any chosen load increment, showing both spreadsheet and Strand7 results. Note that at moments just above the concrete cracking moment there are differences between the spreadsheet and Strand7 interpolation methods, resulting in noticeably different deflections:
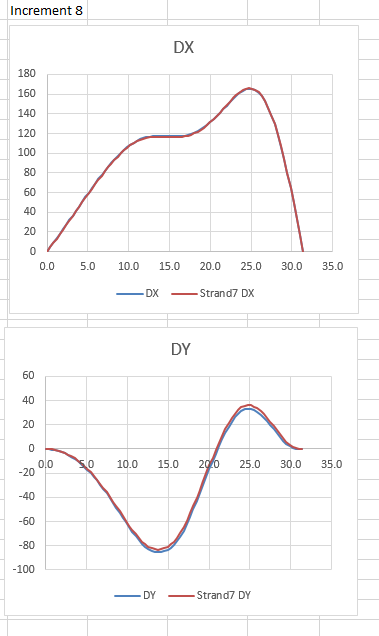
With increased loading however these differences reduce, with deflections under the final loading being very similar:
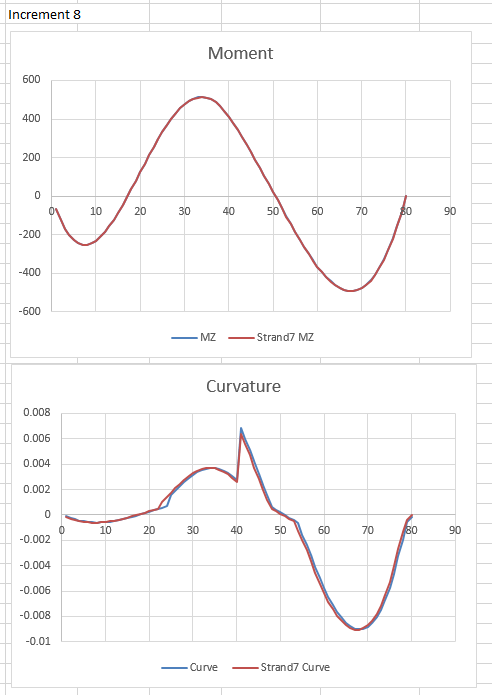
The ForceRes sheet has similar graphs for bending moment around the arch, showing good agreement between the two programs in the final bending moment output. The curvature results again show small differences in interpolation, especially at the transition from cracked to uncracked behaviour:

Pingback: Year 9 Report | Newton Excel Bach, not (just) an Excel Blog