
The xlwings documentation covers de-bugging, but it is very brief and it took me some time to get everything working, so this article covers the process in a bit more detail. The details are affected by the editor being used, and the process described here applies to PyCharm, Community Edition 2016.3.2.
The first example uses the xlwings Fibonnaci sample (download fibonnaci.zip). The Python code must be amended as shown below, with the code for the standalone version commented out (or deleted), and code added to set up a “dummy caller”:
#if __name__ == "__main__":
#  Used for frozen executable
#    xl_fibonacci()

if __name__ == '__main__':
# Expects the Excel file next to this source file, adjust accordingly.
    xw.Book('fibonacci.xlsm').set_mock_caller()
    xl_fibonacci()
Note that:
- The code must be modified for each routine to be de-bugged, with the name of the Excel file calling the Python routine, and the name of the Python function.
- The current xlwings documentation, at the time of writing, has a typo. The code uses the file name ‘myfile.xlsxm’, rather than ‘myfile.xlsm’, which causes a file not found error if copy and pasted. Update 30 Jan 2017: Now fixed in the docs for Version 0.10.3.
For a new installation of PyCharm the Python Interpreter must first be configured. When a new py file is opened the editor displays a “Configure Python Interpreter” link in the top-right corner, where you can connect to your Python executable, as shown in the screen-shot below (click on any image for a full-size view):
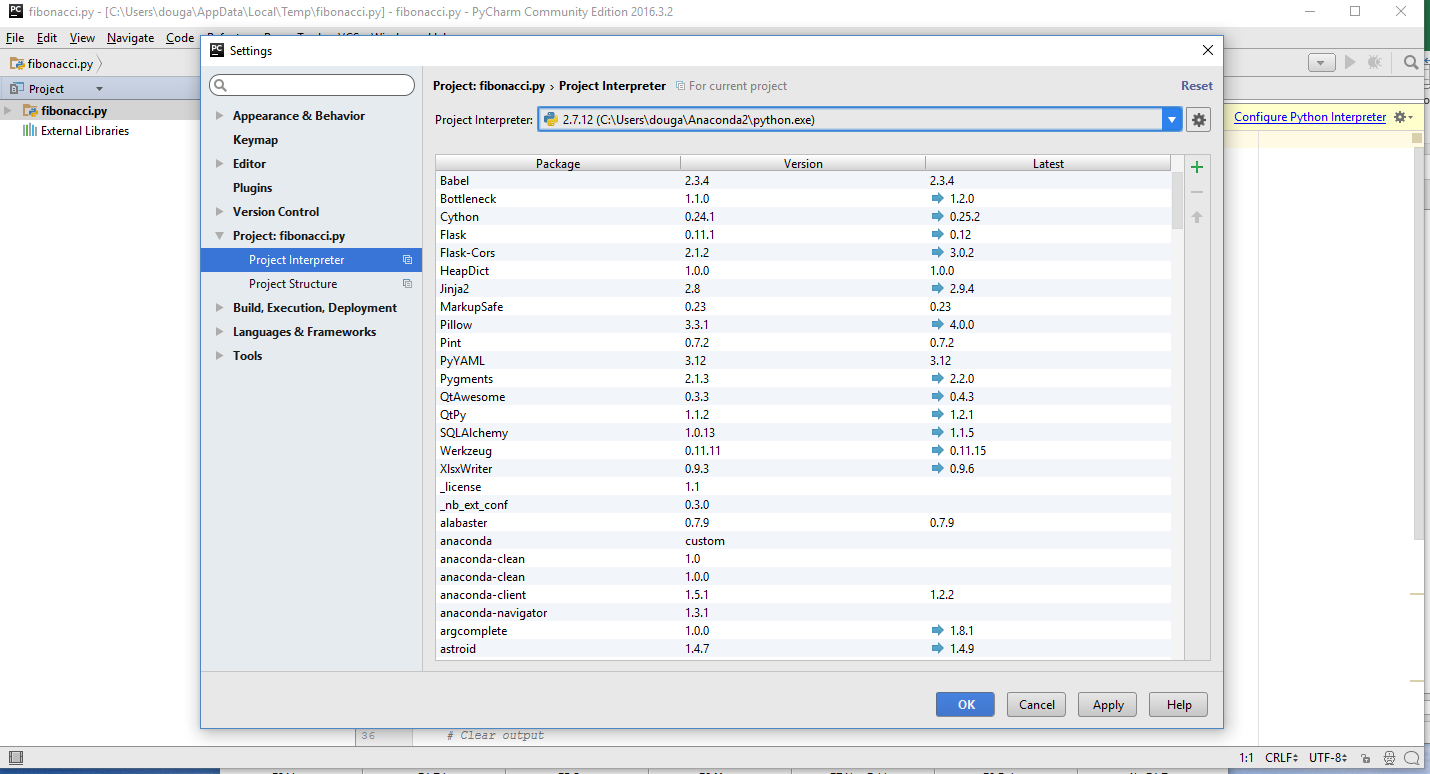
The chosen file can be set as the default with the File-Default Settings-Project Interpreter menu.
Having set the interpreter a de-bug session can be initiated by:
- Insert a break-point at the desired location in the code (click in the left hand margin).
- Use the Run-Debug menu to start the chosen routine:

It is then possible to step through the code using either the Run menu, the associated function keys, or the de-bug step icons under the main edit window.
The value of active variables is shown both adjacent to the code, and in the Variables window.
After the first de-bug run, Run and De-bug icons become active in the top right hand corner, and these can be used to start a new run.
De-bugging a user-defined function (UDF) has a couple of differences. The if __name__ == ‘__main__’ statement must be changed as shown below:
if __name__ == '__main__':
    xw.serve()
In the VBA code, the xlwings function Settings is amended with:
- UDF_DEBUG_SERVER = True
The de-bug process is now initiated in the same way as before. PyCharm will display:
Connected to pydev debugger (build 163.10154.50)
xlwings server running, clsid={506E67C3-55B5-48C3-A035-EED5DEEA7D6D}
To step through the chosen UDF, go to Excel, select any copy of the function in a worksheet, press F2 and then Enter (or Ctrl-Shift-Enter for an array function), as for a VBA function. PyCharm should then run to the first break point:

Stepping through the code then has the same options as when running a subroutine:

nbsp;
