
Another example using Fortran code published in Programming the Finite Element Method (5th ed. John Wiley & Sons, I.M. Smith, D.V. Griffiths and L. Margetts (2014)), this post provides a spreadsheet based frame analysis program including non-linear bending behaviour and 2D or 3D analysis, linking to Fortran solver functions, via Python and xlwings. Note that at present the spreadsheet has only rudimentary functionality for post-processing and plotting of results, and only provides input for loads at nodes, so for linear analysis the spreadsheets Frame4 and 3DFrame provide better functionality.
The new spreadsheet and related files, including full open source code, may be downloaded from:
NonLin-Frame.zip
To run the spreadsheet, in addition to Excel, the requirements are:
- Python, including Numpy, Scipy and Ctypes
- Xlwings
- The provided compiled Fortran files, Main.dll and Geom.dll may be installed anywhere on the system path, or in the same directory as the spreadsheet and Python files.
The simplest way to install the required Python modules is to install Anaconda Python, which includes xlwings. The program has been tested with Python 2.7. It should work with Python 3, but if not, please let me know.
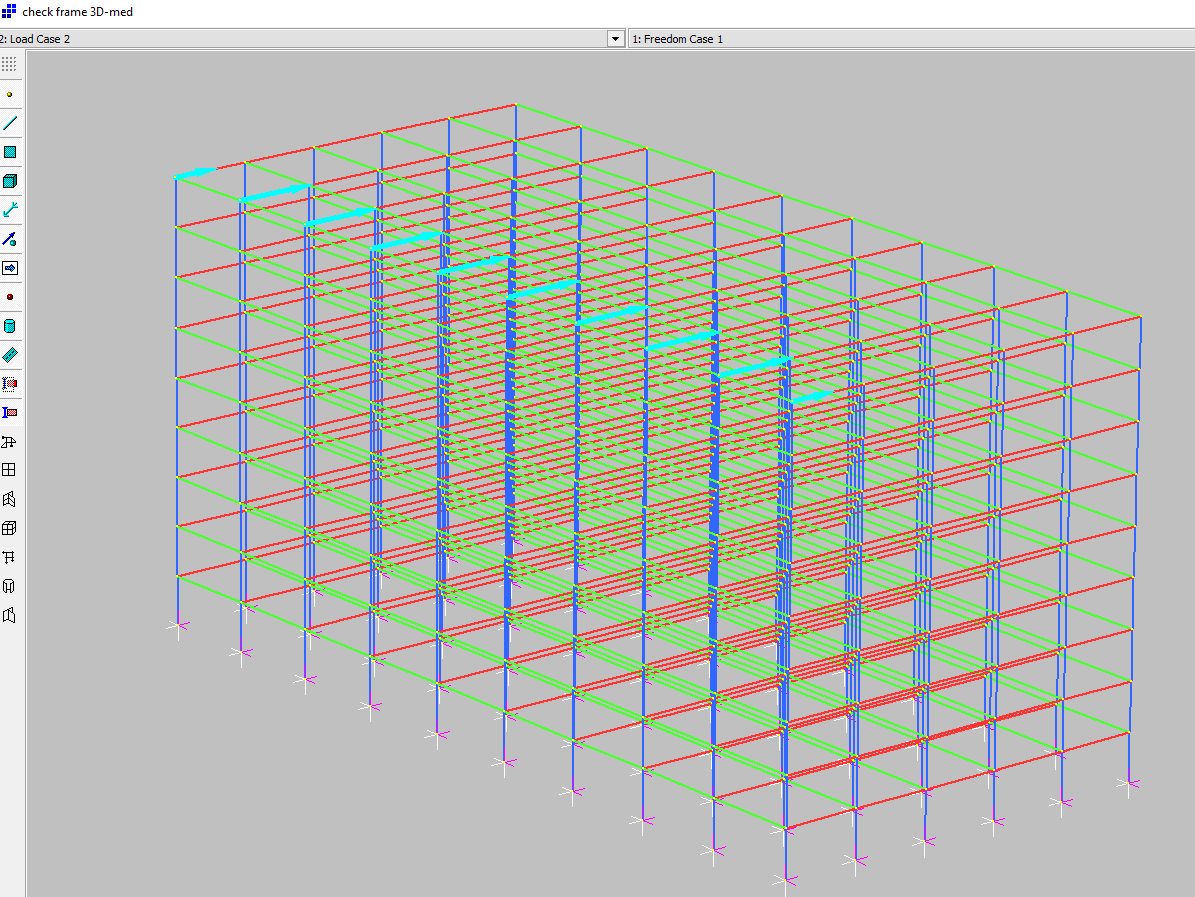
The program is based on Program P45 from Edition 5 of Programming the Finite element Method. The beam elements are treated as elastic – perfectly plastic, and specified nodal loads may be factored in any number of load increments. The download file includes data for the 3D frame analysis shown below:
Data is input on the spreadsheet, with any number of material types, nodes and beam elements (up to the 1 million+ rows provided by Excel):

Forces and moments are applied at nodes only in the current version. Specified loads are factored by any number of load increments:

Input for 2D analyses is in a similar format, with data restricted to the available freedoms (X and Y directions, and moments about the Z axis):

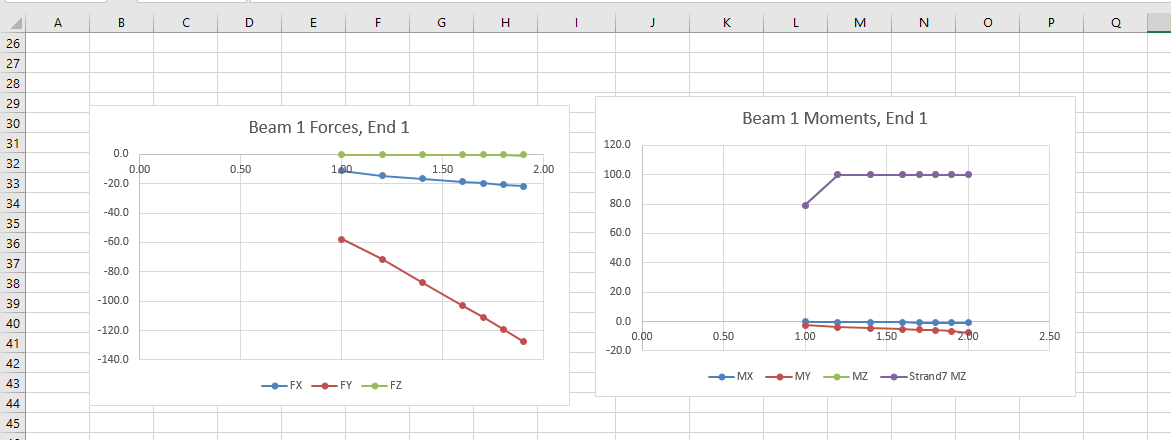
The analysis is run by clicking a button on the “Results” sheet. Full lists of node deflections and beam end actions are copied to the “Deflect” and “StressRes” sheets respectively. At present the “Results” sheet only provides a brief summary of each load increment, and plots of deflections for one node, and forces and moments for one beam, with up to 8 load increments. This will be extended in later versions.

The example output also plots X deflection and Z-axis moment results from the finite element analysis program Strand7, using the same elastic-plastic beam properties. It can be seen that there is good agreement between the two, although not exact due to different methods of modelling the non-linear behaviour.
Strand7 provides a facility to re-number nodes, to improve the efficiency of the matrix solution process. Three different node numbering sequences have been copied to the spreadsheet, and it can be seen below (row 7) that the solution times for this medium sized frame are almost unchanged. For a larger frame (2730 Nodes and 7065 beams) the “tree” node sequence was about four times faster than the other two options.


Not a job for you I know, but surely it is time these solvers were recoded using the amazing matrix handling of python?
LikeLike
Hi Bill, actually that’s part of the plan.
The previous spreadsheets posted in the recent series used Python purely as a link from Excel to the Fortran. In this one the top level code has been translated to Python, calling the Fortran subroutines for the maths intensive bits. The next stage is to try the Scipy sparse matrix solvers, which I’m hoping will give much better performance with very big models.
LikeLike
Pingback: Non-linear Frame Analysis – Scipy solvers | Newton Excel Bach, not (just) an Excel Blog
Hi Doug,
Do you have plans to make loads on members possible for non-linear frame analysis? Or can I modify Frame4 myself? I think that’s difficult for me as a structural engineer with only basic understanding of VBA programming.
regards,
Arend van Wijngaarden, The Netherlands
LikeLike
Arend – I’m working on it, but I don’t know when I will be ready to post anything; just depends on what other things I have to do.
In the mean time, you are free to add to or modify the code, or if you don’t want to change the VBA it would be quite simple to set up a non-linear analysis process on the spreadsheet.
You could use the non-linear program, and set up a range to calculate node loads from distributed beam loads, or you could use Frame4 (or 3DFrame), and recalculate the stiffness for each beam, and iterate until the results converged. You would need a different property type for each beam, but for a small model it would be quite easy to set up.
See: https://newtonexcelbach.wordpress.com/2012/12/11/extending-frame4-with-on-sheet-formulas/
for an example of what I have in mind.
LikeLike