
Following my recent post on passing 3D arrays from Python to Excel I have now added a py_UmomC function to the py_RC Design spreadsheet. The new spreadsheet and Python code, along with related code, can be downloaded from:
Also see py_RC Design 2 for more details of the other functions in the spreadsheet, and Python and pyxll for information about the required pyxll add-in, together with a discount voucher for new users.
The new py_UmomC function returns all the results from py_Umom as a cache object, which displays the cache name in a single cell. If the results are for a single axial load and/or cross section the cache is 2D, but if the input axial load was an array the cache is a 3D array, with each “sheet” having the results for each axial load value.
The chosen results can be displayed with the py_array3D function. In the example below results are displayed for Column 11, Row 3 (the ultimate shear capacity), and because the Sheet is entered as zero results are returned for all input axial loads:

Changing the Column/Row values to 2 and 4 returns the ultimate bending capacity:

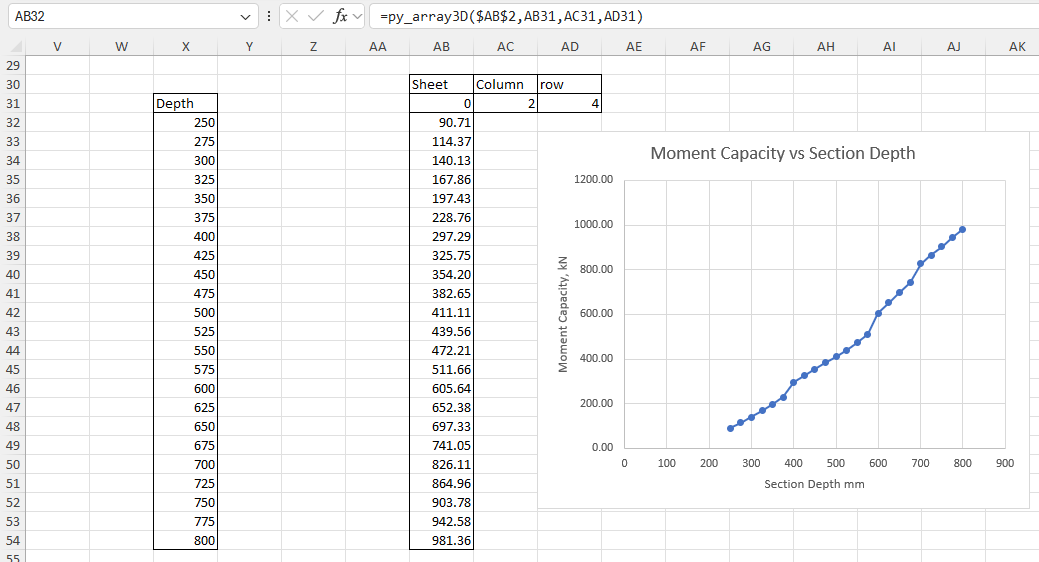
The py_Umom function can also return results for an input array of section depths, optionally with associated reinforcement areas. The axial load may be varying or constant:

As before, different results are returned using the py_Array3D function calling the same cache object with different column and/or row specified:
If the output row is entered as 0 the results are returned as a 2D array, with all the results for the specified column and each axial load in the results columns:

Specifying a single column and sheet returns a column array for the specified axial load, and/or cross section:

and specifying Sheet, Column, and Row returns a single value:


I just discovered your blog. FINALLY, some PY equations that are more than “Hello World”
LikeLike
🙂
LikeLike