
The previous post looked at options for displaying 1D or 2D arrays in Excel. This post will look at passing 3D arrays from Python to Excel as a cache object, using pyxll, and how to extract selected data from the cache. It will use the py_Umom function, as in the last post, with the addition of functions to handle the cache object. The new code is still being finalised, but will be made available for download when complete.
The py_Umom function calculates the ultimate strength of a reinforced concrete section subject to specified applied loads. Results of the analysis are available in 12 different column arrays, one of which must be chosen when the function is entered. The screenshot below shows the first 3 of the 12 results arrays, each of which must be entered as separate function:
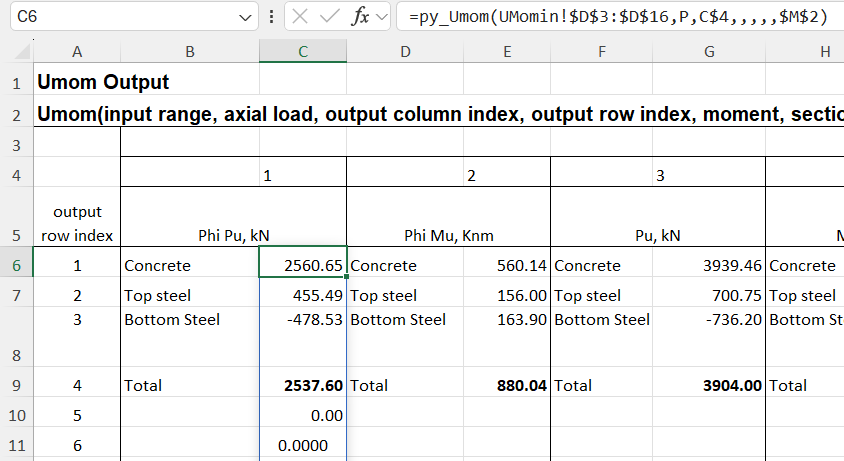
The new py_UmomC function combines all 12 columns into a 2D array. In addition it is possible to calculate results for any number of different applied axial loads, in which case all the results are combined into a 3D array. In either case, the results are returned as a cache object, which displays as text in a single cell. Chosen results from the cache can then be displayed using the py_array3D function, as illustrated below.
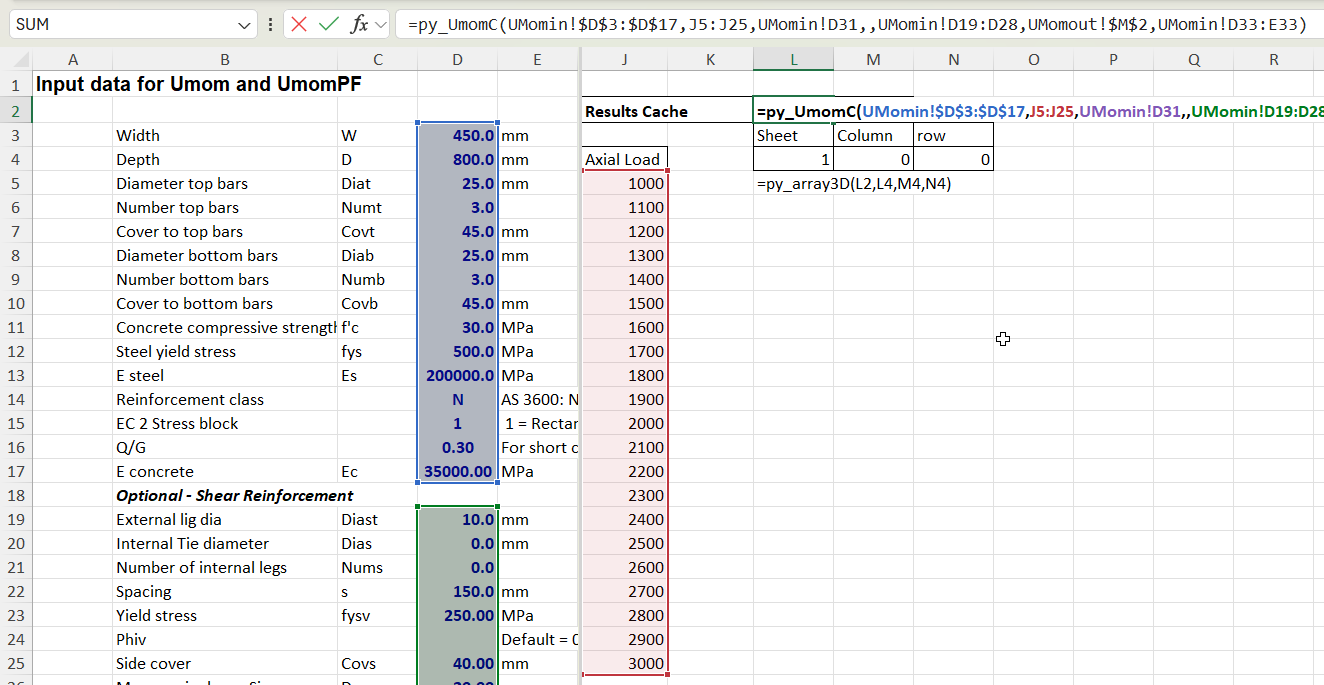
Input for the py_UmomC function is the same as for py_Umom, except that no output index values are required because the function returns all available results. In the example below the py_UmomC function is entered in cell L2, and the input includes a range of 21 different axial loads:
Selected results can then be displayed with the py_array3D functions, which has options for displaying a selected “sheet”, and/or optionally selected columns or rows. If column and row are not selected the function returns all results for the specified axial load:
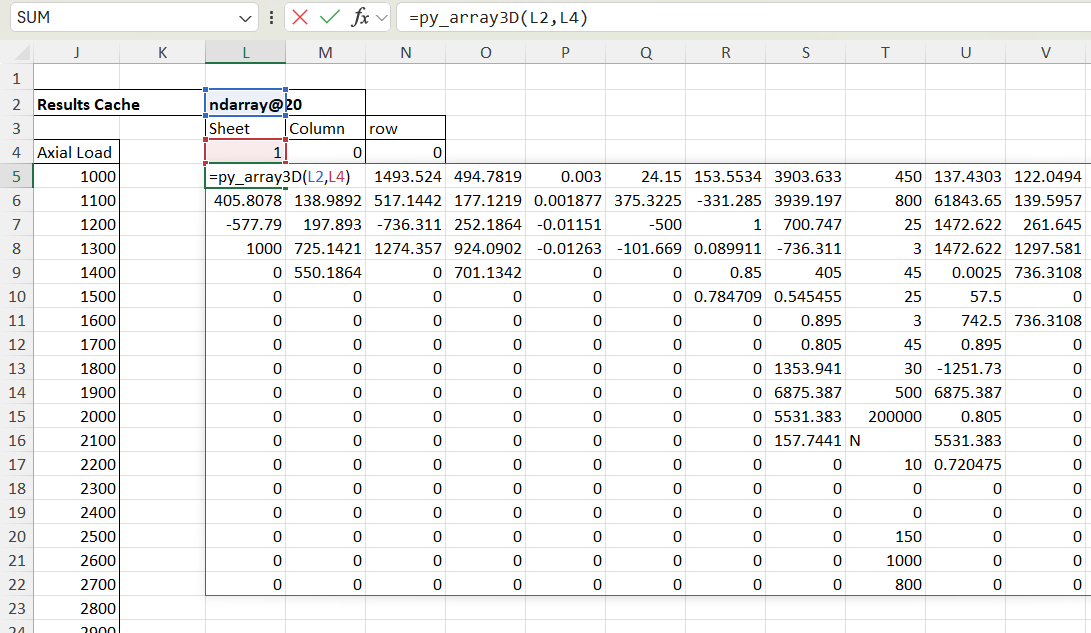
If a column is specified, and the sheet is set to zero, the function returns results for the specified column over the full range of axial loads, returned as a 2D array:
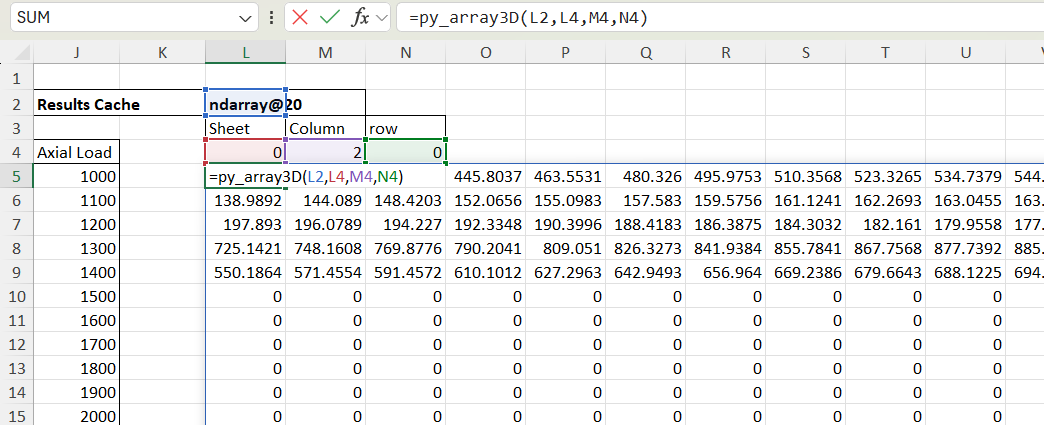
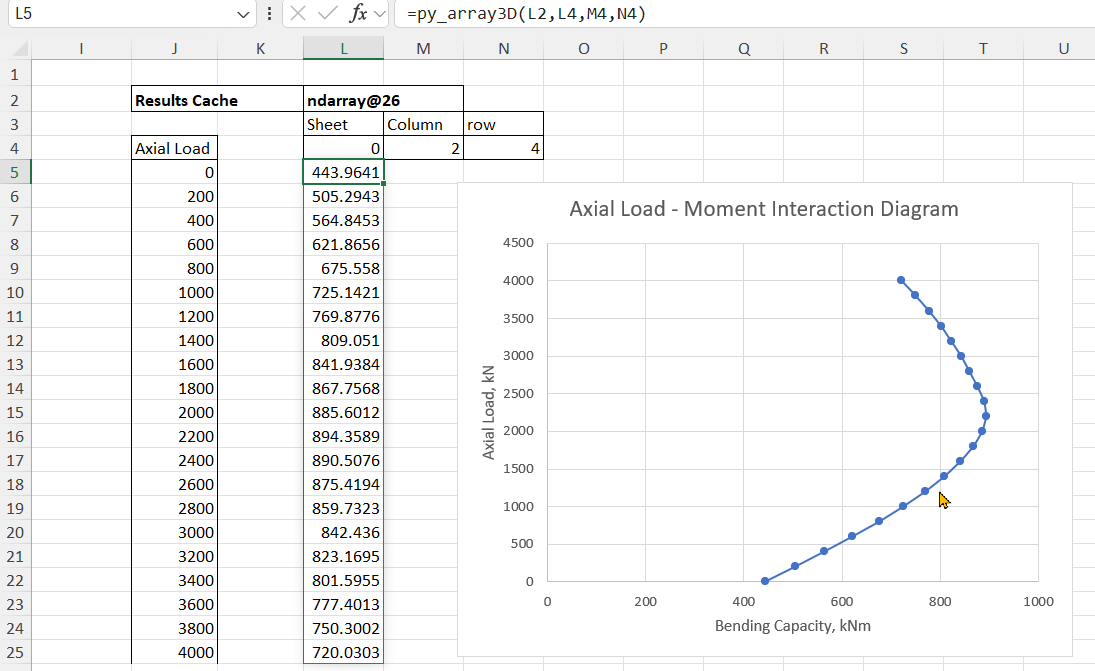
If a row is then specified the results for that value over the input axial load range are returned as a column array. In the example below the results are total design bending capacity:
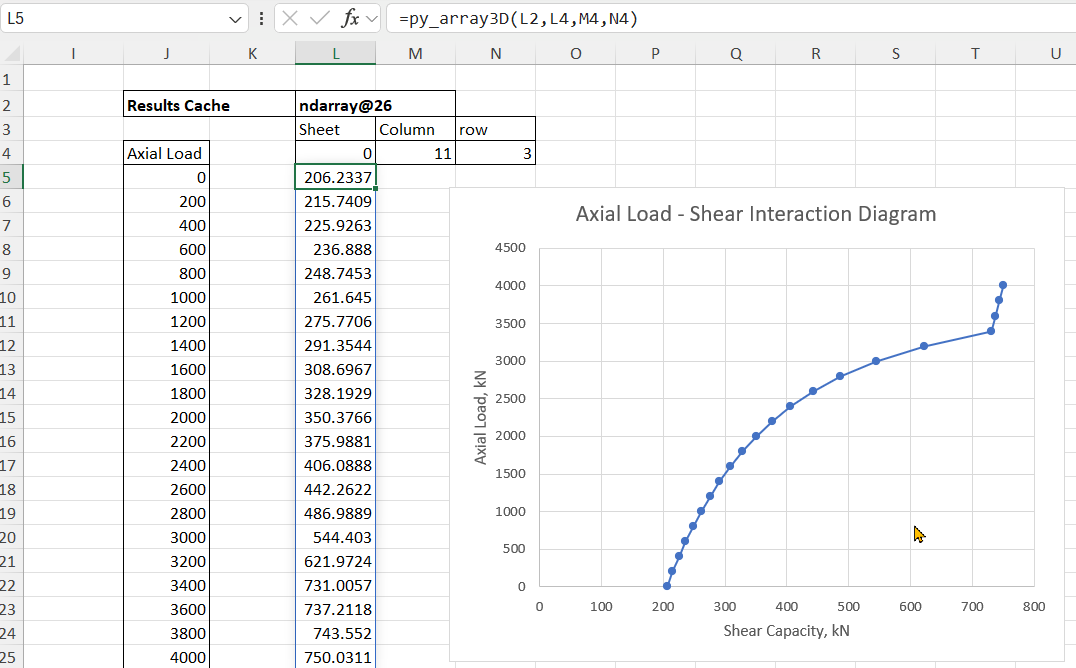
Any other results can then be extracted from the results cache, for example total design shear capacity:

Pingback: py_RC Design with 3D Cache | Newton Excel Bach, not (just) an Excel Blog