New GROUPBY and PIVOTBY functions

Microsoft recently announced two new functions that provide similar functionality to pivot tables, but will update automatically for any change in the referenced data.

These functions are currently rolling out to users enrolled in the beta channel for Windows Excel and Mac Excel.

I’m excited to announce Excel’s new GROUPBY and PIVOTBY functions. These functions allow you to perform data aggregations using a single formula. And while these functions are extremely powerful, they are also simple to get started with. In fact, you can do a data aggregation with just 3 arguments, the same number as a simple XLOOKUP. 

Note: These are preview functions, their signature and results may change substantially before final release based on user feedback. Until final, we do not recommend using them in important workbooks.

https://techcommunity.microsoft.com/t5/excel-blog/new-aggregation-functions-groupby-and-pivotby/ba-p/3965765

See the link above for more details and also the article below from myOnlineTraininghub. Both include full descriptions and examples of the new functions:

The GROUPBY and PIVOTBY functions are a significant breakthrough in Excel’s toolbox of functions.

They let you easily group or aggregate data, a concept that’s been around in Excel since the days of PivotTables in 1993 and Power Query since 2010.

But what’s exciting about GROUPBY and PIVOTBY is that they simplify this process down to a formula.

This means any changes to the source data are instantly updated in your reports, unlike PivotTables which require a click of the Refresh button to update.

But what about Slicers, which are one of the best features of PivotTables?

Don’t worry, I’ll share a clever trick so you can still use Slicers with GROUPBY and PIVOTBY

https://www.myonlinetraininghub.com/excel-groupby-and-pivotby-functions
Posted in Computing - general, Excel | Tagged , , , , , , | Leave a comment

Scipy Functions with Excel and pyxll 9 – Special, distance, space and constants functions and FFT

In the final post in this series I will look at linking Excel to the Scipy special, distance, space and constants functions and also the Fast-Fourier Transform (FFT) functions.

The py_Special-Dist and py_FFT spreadsheet, with associated Python code in PythonSpaceFuncs3.py and pyScipy3.py, are included in the download file. There have been significant changes since the previous post, so download the latest version at:

py_SciPy.zip

Details of the required pyxll package (including download, free trial, and full documentation) can be found at: pyxll

For those installing a new copy of pyxll, a 10% discount on the first year’s fees is available using the coupon code “NEWTONEXCELBACH10”.

The coded Scipy documentation can be displayed in Excel, using the get_docs function:

The Scipy special functions are called with the py_CallfuncS function. The spreadsheet lists the 220 available functions with a description, and is set up to generate simple examples:

The Distance worksheet shows alternative methods to call the distance functions:

The Space worksheet has examples of the py_Delaunay, py_ConvexHull and py_Voronoi functions:

The Scipy constants return a range of physical constants, including definition of units, accessed with py_GetConst:

The NIST CODATA constants can be accessed with the py_GetCodata function:

The py_FFT spreadsheet has an example from the Scipy documentation, using the functions py_fft, py_fftfreq, and py_ifft:

The FFT results are also plotted using Matplotlib with the py_plot function:

More information on using Matplotlib with Excel can be found at:

Posted in AlgLib, Excel, Link to Python, NumPy and SciPy, PyXLL, UDFs | Tagged , , , , , , , , , , , , , | Leave a comment

Scipy Functions with Excel and pyxll 8 – Statistics

This post looks at linking Excel to the Scipy and Pandas statistics functions using pyxll.

The py_Stats spreadsheet, with associated Python code in PythonStatsFuncs3.py and pyScipy3.py, are included in the download file:

py_SciPy.zip

Details of the required pyxll package (including download, free trial, and full documentation) can be found at: pyxll

For those installing a new copy of pyxll, a 10% discount on the first year’s fees is available using the coupon code “NEWTONEXCELBACH10”.

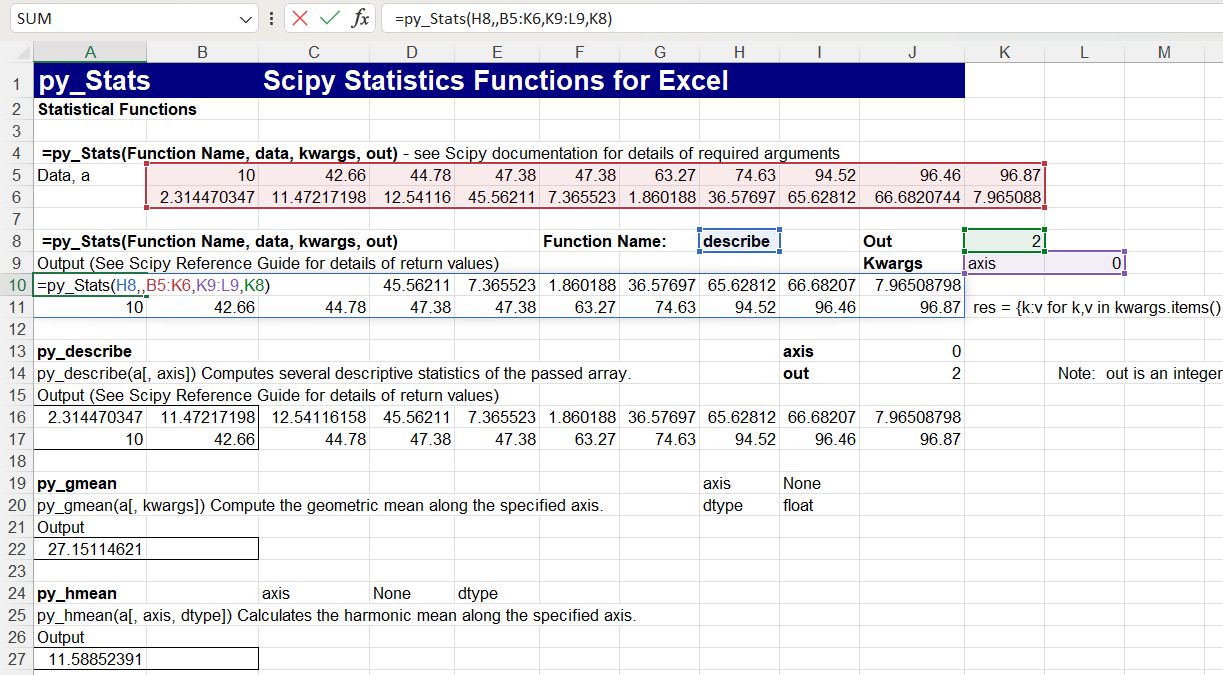
The py_Stats spreadsheet is still under development, but links to most of the Scipy statistics functions. As shown below, the functions may either be called with specific Excel UDF’s, or using the general purpose py_Stats function:

For background information on passing “callable” arguments from Excel to Python see:

Python callable arguments from Excel

Links to the Scipy on-line documentation have not yet been implemented for the stats functions, but a text version of the documentation for any function can be displayed in the spreadsheet:

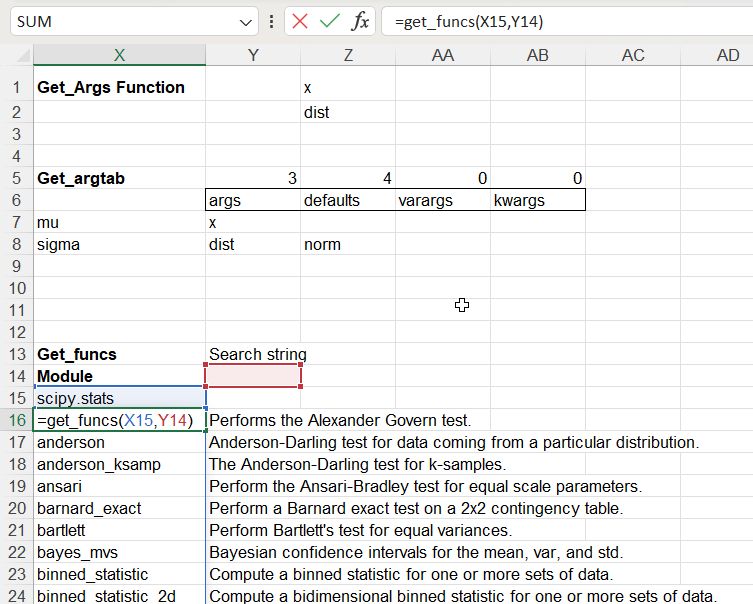
The “Index” input links to a full list of the available Scipy functions, using the get_funcs() function:

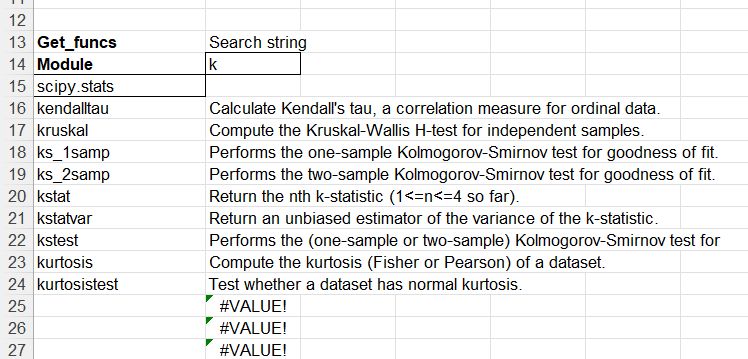
A search string can be added to narrow down the list of functions:

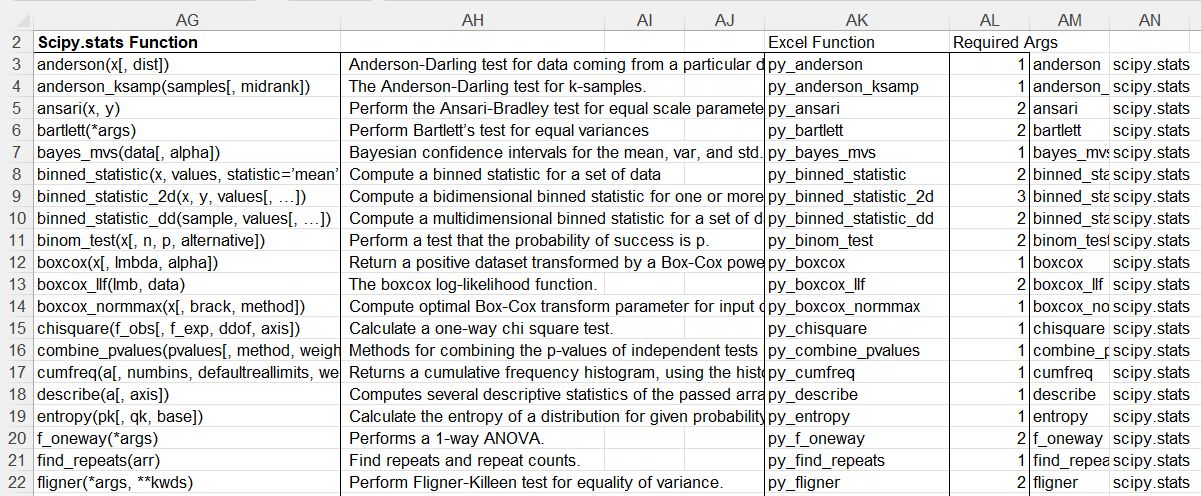
The specific Excel functions available are also listed:

There is also a list of functions not yet implemented in:

Finally the Pandas statistics functions are also available:

Posted in Excel, Link to Python, Maths, Newton, NumPy and SciPy, Python Pandas, PyXLL, UDFs | Tagged , , , , , , , , | 1 Comment

Scipy Functions with Excel and pyxll 7 – Linear Algebra

This post looks at linking Excel to the Scipy linear algebra functions using pyxll, and also using the PyPardiso solver. Previous posts on this topic include:

The pyLinAlgfuncs3 spreadsheet, with associated Python code in pyLinalgfuncs3.py and pyScipy3.py, are included in the download file:

py_SciPy.zip

Details of the required pyxll package (including download, free trial, and full documentation) can be found at: pyxll

For those installing a new copy of pyxll, a 10% discount on the first year’s fees is available using the coupon code “NEWTONEXCELBACH10”.

The pyLinAlgfuncs3 spreadsheet includes links to many different solver functions and associated utility functions, but for most purposes the py_Solve (for dense matrices) or py_SpSolve (for sparse matrices) will be most efficient. Note that the py_SpSolve function calls the fast PyPardiso sparse solver if it is installed, or the Scipy spsolve function if not.

Links to the Scipy on-line help are available for most of the functions by opening the function dialog box, and clicking on “Help on this function” in the bottom left corner:

This links to the Scipy help for the associated Scipy fumction:

Input of the matrix to be solved may be in alternative formats:

  • A complete square matrix on the spreadsheet.
  • A linked list in COO format on the spreadsheet
  • A pyxll cache object. Note that this option allows links to Python generated arrays that would be too big to transfer to a spreadsheet, and will also be much faster for very large matrices.

The SpSolveit sheets has functions linking to 10 alternative sparse iterative solvers. 

See Speed of Scipy Linear Algebra Solvers for more information on the relative speed of the solvers for typical structural engineering applications.

The LuSolve sheet has functions for factorisation and solving using LU factorisation.

ChoSolve has Cholesky and banded solvers:

Python_LU has functions demonstrating background to the LU solver approach. See LU decomposition with python and scipy for more details.

Finally the Misc sheet has examples of various matrix related functions:

Posted in Arrays, Excel, Finite Element Analysis, Frame Analysis, Link to Python, Maths, Newton, NumPy and SciPy, PyXLL, UDFs | Tagged , , , , , , , , , , , | 1 Comment

Scipy Functions with Excel and pyxll 6 – Integration

The py_Integrate spreadsheet, with associated Python code in pyScipy3.py, are included in the download file:

py_SciPy.zip

The spreadsheet and associated Python packages have had significant edits since the first post in this series, so please download the latest file.

Details of the required pyxll package (including download, free trial, and full documentation) can be found at: pyxll

For those installing a new copy of pyxll, a 10% discount on the first year’s fees is available using the coupon code “NEWTONEXCELBACH10”.

The py_Integrate spreadsheet links to the Scipy quadrature functions. In addition, a Python version of the VBA Quad_Tanh_Sinh function by Graham Dennes has been added. See Tanh-Sinh Quadrature v. 5.03 for details and download of the VBA version.

Three functions allow for integration of functions with one variable:

The Tanh-Sinh version works with either a string on the spreadsheet or a Python function:

The Scipy and Tanh-Sinh functions return near identical resuts:

For typical functions the Tanh-Sinh function is a little slower than the Scipy functions, since it is written entirely in uncompiled code, but for functions requiring a large number of iterations it can be faster:

The spreadsheet includes examples with trigonometric functions, with results accurate to machine precision:

There are also functions linking to the Scipy functions for double, triple, and multiple integration, with examples of each:

Posted in Excel, Link to Python, Maths, Newton, Numerical integration, NumPy and SciPy, PyXLL, UDFs | Tagged , , , , , , , , , , | Leave a comment