Reinforced Concrete Section Analysis – 1

Increased yield strengths of reinforcing steels have increased the importance of the Serviceability Limit State in reinforced concrete design, with SLS reinforcement stresses, crack widths, or deflections often controlling the design.

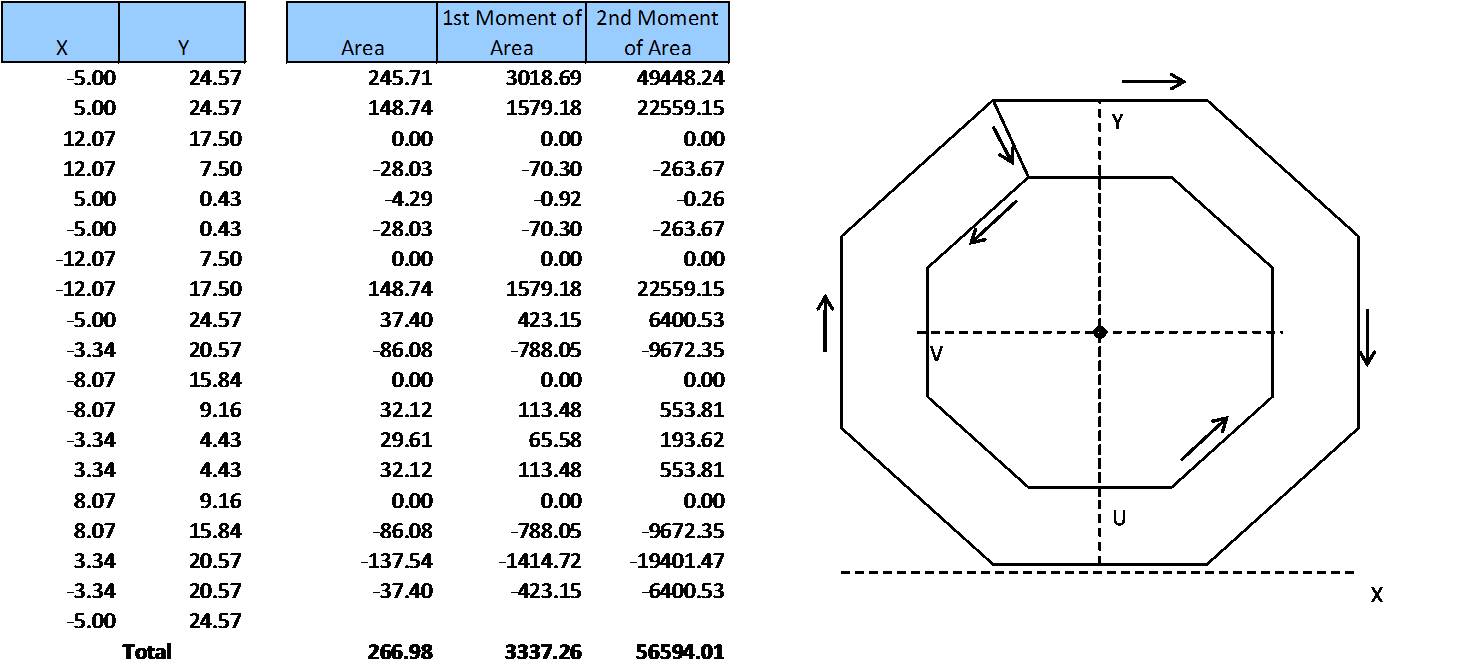
Elastic analysis of a rectangular section under pure bending can be solved easily with a quadratic equation, but for more complex shapes or combined bending and axial load an iterative process is normally used to determine the position of the neutral axis and section strains and stresses.

Click on: RC NA Depth for a paper presenting closed form solutions for any symmetrical reinforced concrete section, with any number of layers of reinforcement, under combined bending and axial load.

An extract from the paper is shown below:
NA Depth

Future posts will describe how these equations can be conveniently solved in an Excel VBA UDF, including calculation of concrete and reinforcement strains and stresses.

Posted in Beam Bending, Newton | 4 Comments

Section Properties of Defined Shapes – Spreadsheet

Download section properties spreadsheet from:

http://www.interactiveds.com.au/software/Section%20Properties03.zip

http://www.interactiveds.com.au/software/Section%20Properties07.zip

  • Section properties for 35 defined shapes
  • Section properties from coordinates
  • Section properties UDF

Screen shots:

Screenshot 1
Screenshot 2

Posted in Excel, Maths, UDFs | Tagged | 29 Comments

Section Properties from Layers

An alternative to finding the section properties of irregular polygons from the coordinates of the corners is to divide the shape into rectangular or trapezoidal layers.  The properties of the shape may then be found by simply summing the properties of each layer about a common axis.  The applicable equations for rectangular and trapezoidal layers are:

Layers1

layers2

Layers3

Posted in Maths, Newton, Uncategorized | Tagged , , , , | 1 Comment

Section Properties UDF and UDF charting

The technique for calculating section properties from coordinates is conveniently coded into a UDF:

Function Area(xy_range As Variant) As Double
Dim XYcells As Variant
Dim N As Long, NumX As Long
Dim XD As Double, YSum As Double
XYcells = GetArray(xy_range)
NumX = UBound(XYcells, 1) - LBound(XYcells, 1) + 1
If NumX < 3 Then
 XYcells = Transpose1(XYcells)
NumX = UBound(XYcells, 1) - LBound(XYcells, 1) + 1
 End If
'Iterate index from 1 to 1 less than number of members
  For N = 1 To NumX - 1
  XD = XYcells((N + 1), 1) - XYcells(N, 1)
  YSum = XYcells(N, 2) + XYcells((N + 1), 2)
  Area = Area + XD * YSum / 2
  Next N
End Function

This function, and another (SecProp()) calculating first and second moments of area, and centroid positions, about the X and Y axis may be downloaded from here:
http://www.interactiveds.com.au/software/SecProps-array.zip
Both functions allow the coordinates to be listed in a vertical or horizontal range, or as an array (surrounded by {}) entered directly in the Function.

SecProp() returns a 14×1 array, which should either be entered as an array formula, or an optional output index may be entered to return a specific section property.

Also included is a UDF (XYChart()) to plot shapes defined by coordinates directly in the cell where the function is entered. To enlarge the chart either increase the cell width or height, or select a range of cells and enter as an array formula.

Note that XYChart makes use of undocumented features, and cannot be guranteed to work in future versions. Also note that it clears the undo stack, so undo will not work if it is entered anywhere in the workbook.

 XYChart is adapted from code by Rob van Gelder, posted at: http://www.dailydoseofexcel.com/archives/2006/02/05/in-cell-charting/

Output from Area(), SecProp() and XYChart() are illustrated below:
SecProp

Posted in Arrays, Charts, Excel, UDFs | Tagged | 6 Comments

Section Properties from Coordinates

The area of irregular closed polygons defined by coordinates may be conveniently calculated by summing the areas of adjacent trapeziums, as shown below.   The area of each trapezium is calculated from the X axis.  Note that with the apex coordinates defined in a clockwise direction the area between the bottom of the polygon and the x-axis is first added in (red trapeziums), then deducted (green trapeziums), leaving the correct area for the polygon, shaded blue. Other section properties, such as first and second moment of area, may be found in the same way, taking care to ensure that the formula gives a positive value for a positive XD, and negative for negative XD, for line segments above the X axis, and vice versa for segments below the X axis.
Area1

Arae1a

Voided shapes may be defined by connecting any external apex to one apex of the internal void, then listing the void apex coordinates in an anti-clockwise direction, then finally returning to the external apex.  This procedure is shown for a regular hollow octagon below, but may also be used for any irregular shape, with any number of voids.

Area2b

Posted in Maths, Newton | Tagged , , , , | 2 Comments