The technique for calculating section properties from coordinates is conveniently coded into a UDF:
Function Area(xy_range As Variant) As Double

Dim XYcells As Variant

Dim N As Long, NumX As Long

Dim XD As Double, YSum As Double

XYcells = GetArray(xy_range)

NumX = UBound(XYcells, 1) - LBound(XYcells, 1) + 1

If NumX < 3 Then

 XYcells = Transpose1(XYcells)

NumX = UBound(XYcells, 1) - LBound(XYcells, 1) + 1

 End If

'Iterate index from 1 to 1 less than number of members

  For N = 1 To NumX - 1

  XD = XYcells((N + 1), 1) - XYcells(N, 1)

  YSum = XYcells(N, 2) + XYcells((N + 1), 2)

  Area = Area + XD * YSum / 2

  Next N

End Function
This function, and another (SecProp()) calculating first and second moments of area, and centroid positions, about the X and Y axis may be downloaded from here:
http://www.interactiveds.com.au/software/SecProps-array.zip
Both functions allow the coordinates to be listed in a vertical or horizontal range, or as an array (surrounded by {}) entered directly in the Function.
SecProp() returns a 14×1 array, which should either be entered as an array formula, or an optional output index may be entered to return a specific section property.
Also included is a UDF (XYChart()) to plot shapes defined by coordinates directly in the cell where the function is entered. To enlarge the chart either increase the cell width or height, or select a range of cells and enter as an array formula.
Note that XYChart makes use of undocumented features, and cannot be guranteed to work in future versions. Also note that it clears the undo stack, so undo will not work if it is entered anywhere in the workbook.
XYChart is adapted from code by Rob van Gelder, posted at: http://www.dailydoseofexcel.com/archives/2006/02/05/in-cell-charting/
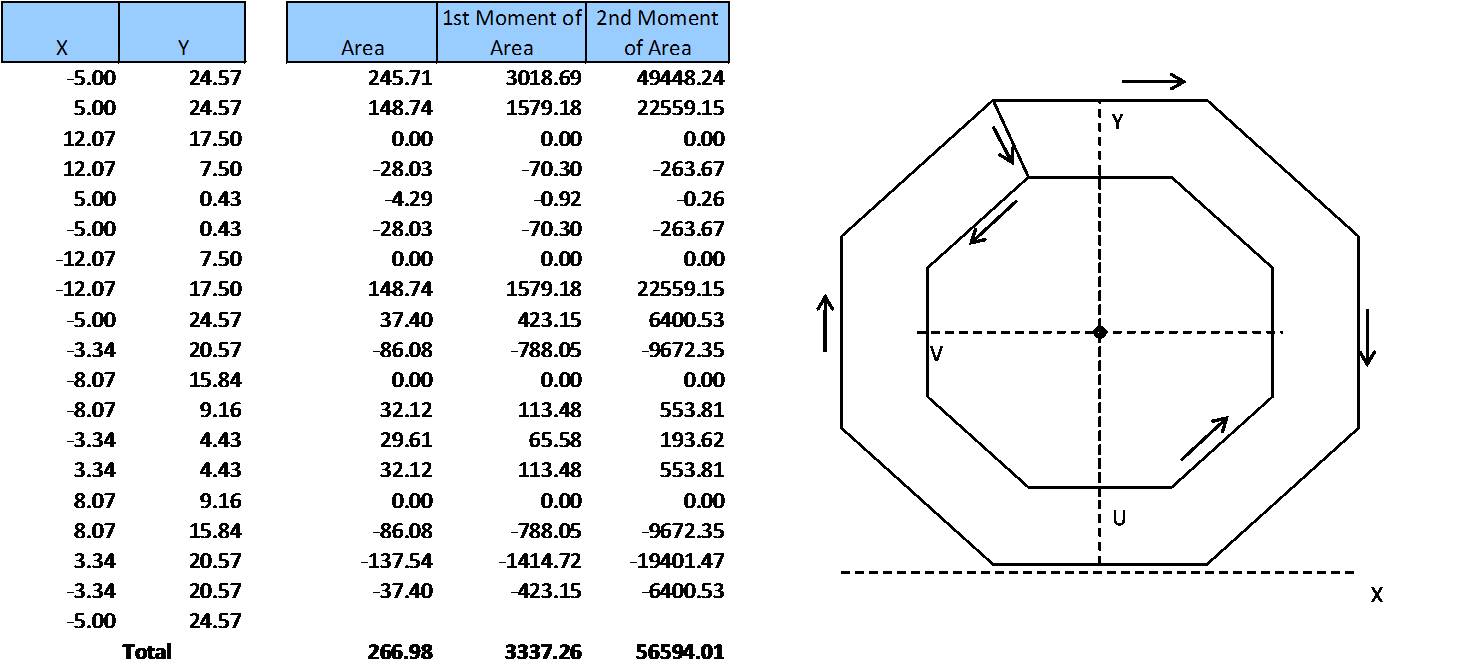
Output from Area(), SecProp() and XYChart() are illustrated below: