
Since the previous post, I have updated the notes in the RC Design Functions spreadsheet to reflect the fact that with the recent update to the Bridge Design Code (AS 5100) the reinforced concrete strength design requirements for beam bending and combined bending and axial load are now the same as in AS 3600. The updated spreadsheet can be downloaded from:
The RCInteract function will generate a moment-axial load interaction diagram to a number of design codes. For AS 3600, and now AS 5100 as well, it will also adjust the results according to the specified confinement steel.
The screen shot below shows input and plotted results for 65 MPa concrete to AS 3600 including the effect of compression steel (blue line), and with compression steel ignored: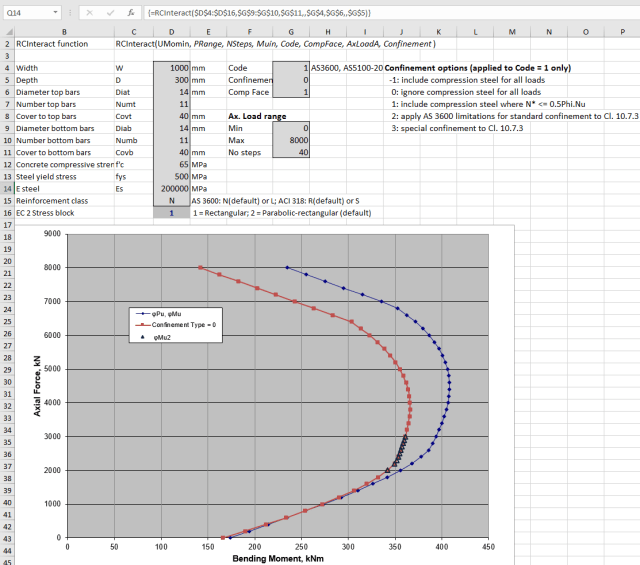
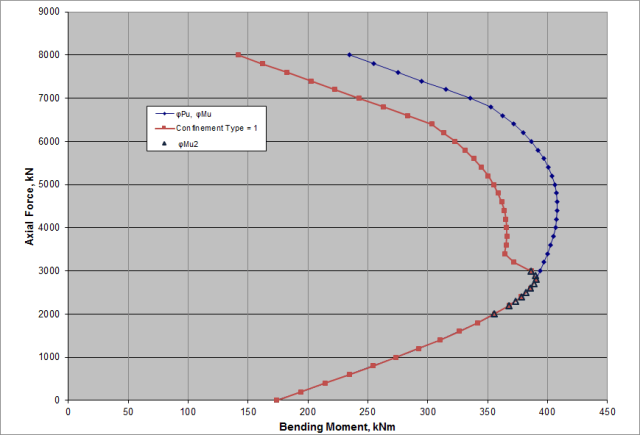
If the confinement option is set to 1 the compression steel is included for axial loads <= 0.5Phi.Nu:
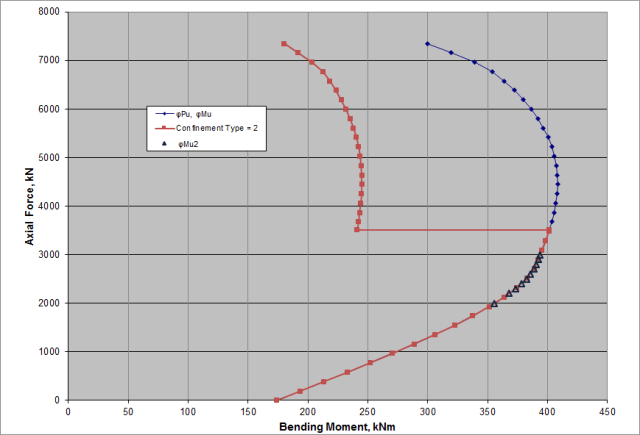
Confinement option 2 applies the AS 3600 limitations for standard confinement to Cl. 10.7.3, for concrete grades >= 65 MPa:
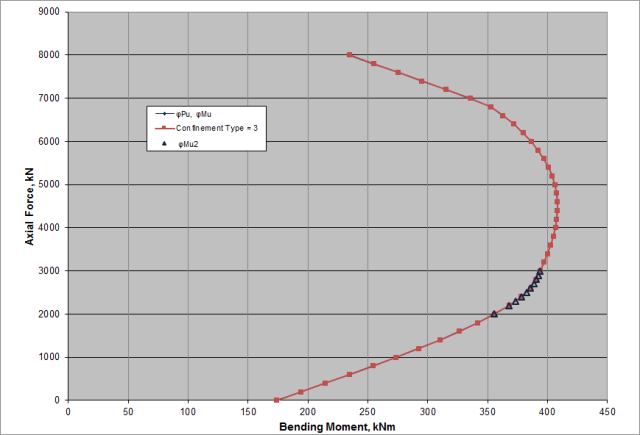
Confinement option 3 gives results where special confinement to Cl. 10.7.3 is provided, i.e. compression steel is included for all axial loads.
The function input is (arguments in italics are optional):
RCInteract(UMomin, PRange, NSteps, Muin, Code, CompFace, AxLoadA, Confinement):
- UMomin: Section details (Range D4:D16 in the example data)
- PRange: Axial load range; default = 0 to Phi.Pu
- NSteps: Number of output increments; default = 20
- Muin: Array of moments for each axial load, defining the compression face; default = use CompFace
- Code: Design code; default = 1 = AS 3600 and AS 5100-2017
- CompFace: Compression Face, 1 = top face, anything else = bottom face; default = 1
- AxLoadA: Array of output axial loads; default = use Prange and NSteps
- Confinement: Confinement option (Code = 1 only); default = -1 (include compression steel for all loads)
Output is an array with 3 or 1 columns, depending on whether AxLoadA was specified; see below:

To display all results the function must be entered as an array function, by selecting the required output range and pressing Ctrl-Shift-Enter. See Using Array Functions and UDFs for details.

 The data consists of three adjacent columns: values and upper and lower tolerances. To run the macro either select just the input data range, or extend the range to the right, then press Alt-F8 and select AddTolerance. The output results will either be written to the column to the right of the input data, or if a wider range was selected, in the last column of the selected range, as shown above.
