xlwSciPy 1.09 – update for xlwings 0.10 and Scipy 0.18.1

The xlwSciPy spreadsheet (last presented here) has been updated for the latest version of xlwings and Scipy.

The new spreadsheet can be downloaded from:

xlScipy-xlw.zip

including full open source code.

The spreadsheet requires Python, including xlwings, Numpy, Scipy and Pandas (all of which are free, and included in the Anaconda package).

The new spreadsheet includes a CubicSpline function, which is new in Scipy 0.18.  Some options for the new function are shown in the screen shots below:

The function has an optional “BC-type” argument, that controls the spline end conditions.  The argument may be entered as a single text string (one of: “not-a-knot”, “periodic”, “clamped”, or “natural”), or a 2×2 array.  The default value is “not-a-knot”, which returns the same results as the xl_UniSpline and xl_Splev functions:scipy4-1

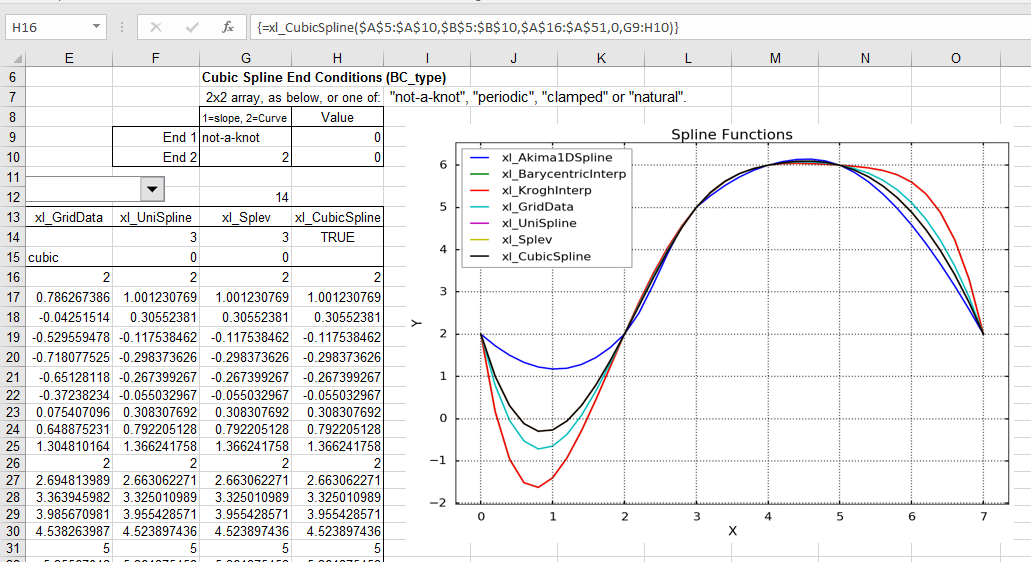
For the “periodic” option the first and last Y value in the spline data must be equal. The function then returns a curve with equal slope and curvature at each end:scipy4-2

“Clamped” end conditions result in zero slope at the ends:scipy4-3

“Natural” end conditions have zero curvature at the ends:scipy4-4

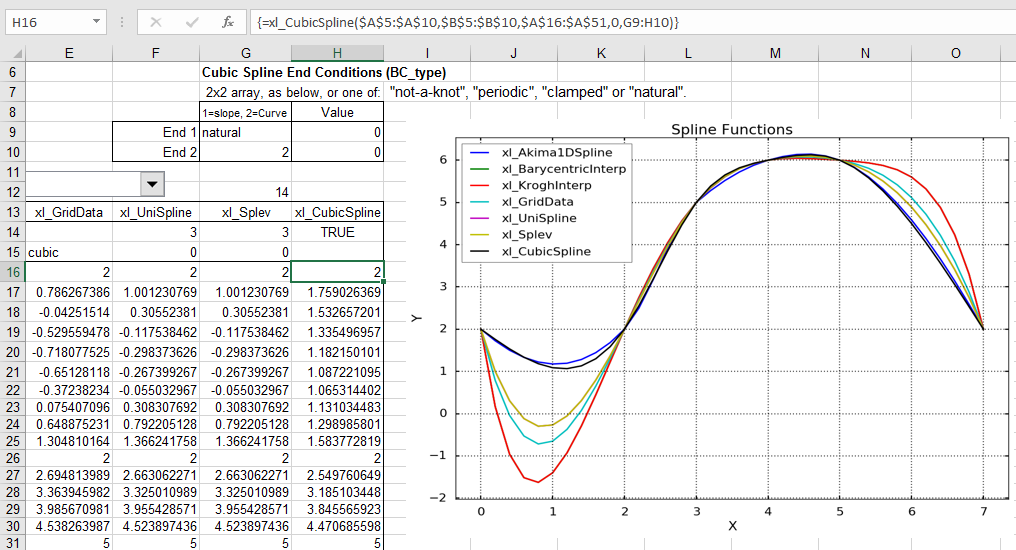
Using the array argument the slope or curvature may be set separately at each end. The input shown below specifies a slope (1 in column 1) of -1 at both ends:scipy4-5

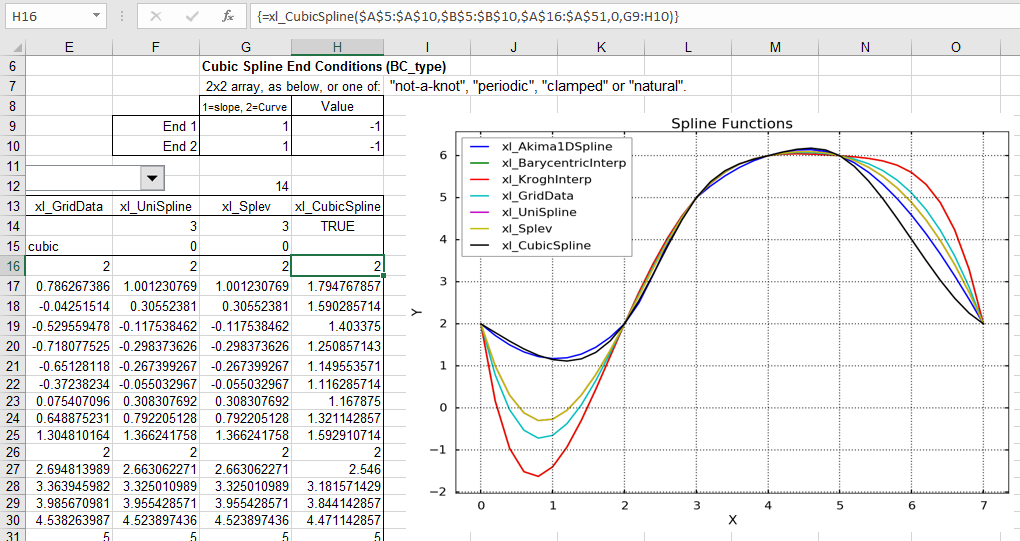
Similarly the curvature may be set to any desired value with a 2 in column 1 of the BC_type array:scipy4-6

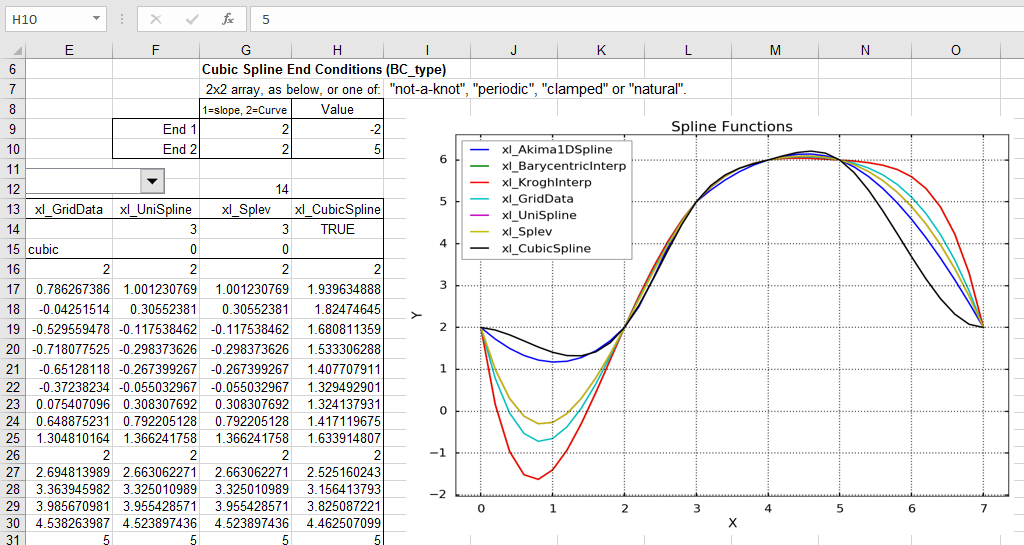
See more detailed documentation at the Scipy Docs.

Xlwings 0.10 introduces a new feature that expands array return values in user defined functions (UDFs) to show all the results, without entering as an array function:scipy4-7

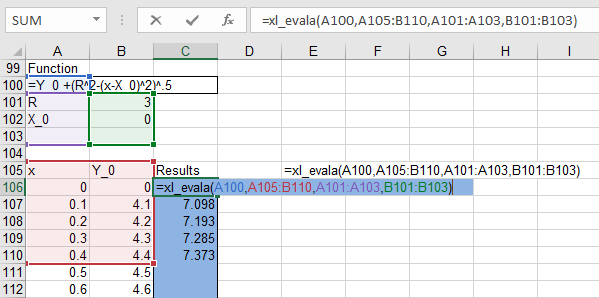
This feature is currently only used in the xl_evala function, on the Eval sheet. Xl_evala returns an array with the same number of rows as the rows with numeric data in the input data.  When entered with the data from row 106 to 110 in the screen shot above, results are  automatically returned to the same rows when the functioned is entered (just press enter, not ctrl-shift enter).

If the input range is extended down to row 136, the output is adjusted to suit: scipy4-8

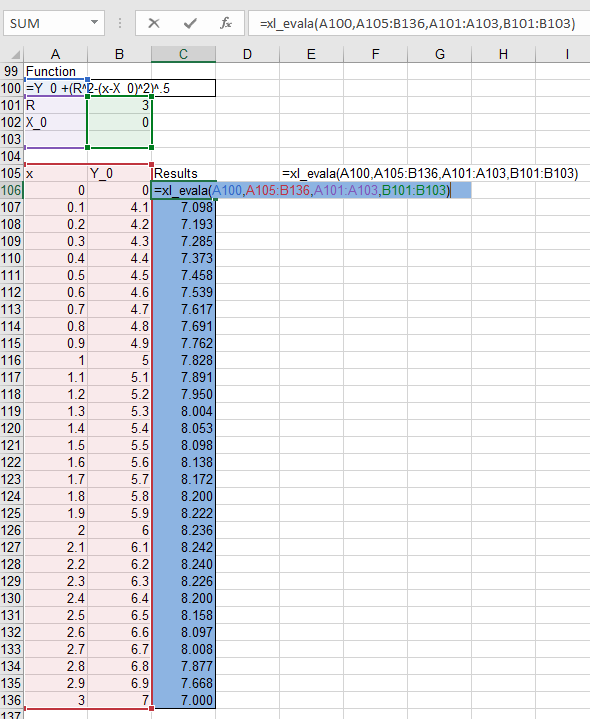
The Python code required is quite short:

@xw.func
@xw.arg("x", ndim=2)
@xw.ret(expand='table')
def rtnarray2(x):
    return x

This can then be called from VBA …:

Function rtnarray2(x)
        If TypeOf Application.Caller Is Range Then On Error GoTo failed
        rtnarray2 = Py.CallUDF("xlwScipy", "rtnarray2", Array(x), ThisWorkbook, Application.Caller)
        Exit Function
failed:
        rtnarray2 = Err.Description
End Function

… and tacked on the end of any other VBA function:

Function xl_EvalA(func As String, xRange As Variant, Optional SymRange As Variant, Optional ValRange As Variant, Optional ReturnType As Long = 1) As Variant
    ...
    Set result = Py.Call(Methods, "xl_Evalx", Py.Tuple(func, xRange, VarName, SymRange, ValRange))
    Set Result_List = Py.Call(result, "tolist")
    Rtn = Py.Var(Result_List)

    Rtn = TransposeA(Rtn)
    xl_EvalA = rtnarray2(Rtn)
    Exit Function


Posted in Arrays, Curve fitting, Excel, Link to Python, Maths, NumPy and SciPy, Python Pandas, UDFs, VBA | Tagged , , , , , , , , | 2 Comments

VBA routines for splitting and joining text

As mentioned in the previous post, I have written two short VBA routines to aid the process of splitting a column of text strings into separate columns, using either a space or any other chosen character as the delimiter.  These routines have been added to the Text-in2 spreadsheet, along with a new JoinText function to reverse the process.  The new file can be downloaded (including full open source code) from:

Text-in2.ZIP

For an example of the use of the new routines see the Txt2Col sheet:

txt2cols2-1

Text (including text from pdf files) can be copied and pasted anywhere.  Select all the rows and as many columns as you want to split, then press Alt-F8, select Text2TextCols, and click Run:

txt2cols2-2

The text in the first column is split into the selected columns in text format, so that the original number formats are retained:

txt2cols2-3

The ResetTxt2Cols macro is for use when the Excel Text to Columns wizard has been used, and you want to paste text copied from external files into a single column.  To run press Alt-F8, select ResetTxt2Cols, and click run.

Split text (or any other text in a continuous column or row) can be combined with the JoinText user defined function (UDF) as shown below:

txt2cols2-4

JoinText has two optional arguments:

  • Separate defines the separator to add between cell contents (default a single space).
  • IgnoreBlank ignores blank cells if set to true.

Excel 2016 now has two new built in functions providing similar functionality, Concat() and TextJoin().  The JoinText UDF still has a couple of advantages however:

  • It will work in any version of Excel that supports VBA.
  •  The Separate and IgnoreBlank arguments are optional, simplifying use when the default values are to be used.
Posted in Excel, UDFs, VBA | Tagged , , , , , , , | Leave a comment

The error made in 20% of papers on genes …

… and how to avoid it.

According to a recent scientific paper “Gene name errors are widespread in the scientific literature” (authors: Mark Ziemann, Yotam Eren1, and Assam El-Osta).  The paper says that “approximately one-fifth of papers with supplementary Excel gene lists contain erroneous gene name conversions”, and that the errors are caused by Excel converting certain gene names into dates, and others into numbers in scientific notation.  A search finds this is nothing new.  A 2004 paper states “Mistaken Identifiers: Gene name errors can be introduced inadvertently when using Excel in bioinformatics”.  The more recent paper has an interesting graph of the frequency of these errors over time:

It seems that the errors were at a low level after the 2004 paper, but have since risen substantially.

Errors of this type are of course not limited to gene names.  Problems with dates being interpreted differently in different regions are widespread, and in the engineering context fractions may be converted to dates, or left as a fraction in text format.

Although  widespread, these problems are reasonably easy to avoid.  This post will look at the built in Excel methods, and the next will present some VBA solutions.  As an example, we will import a table from a pdf file.  The table is copied to the clipboard:txt2cols1-0

When pasted in Excel all the text goes in one column:

txt2cols1-1

The text can be split into columns with the Text to Columns Wizard, under the Data tab, which has three steps.  First select the “delimited” option:

txt2cols1-2

For delimiters select “space” and “treat consecutive delimiters as one”:

txt2cols1-3

Finally select “Text” as the data format for all columns.  To do this in one operation scroll to the right of the data preview, hold down the Ctrl key, and click on the right hand column:

txt2cols1-4

The text is split into columns with text format, so the fractions display as formatted in the original document:

txt2cols1-5

If the same clipboard data is now pasted into another range, Excel remembers the text to columns with space delimiters settings, but not the text format setting, so the integers are pasted as numbers, but the fractions are pasted as either dates or text, depending on whether the fraction can be interpreted as a valid date or not:

txt2cols1-6

To paste the data as text all the cells in the paste range must be formatted as text before pasting.  All the fraction cells will then be pasted in their original format:

txt2cols1-7

The settings selected in the Text to Columns Wizard will remain in place so long as the spreadsheet is open, even if another workbook is opened.  Options for resetting, so that pasted text will go into a single column again are:

  1. Save and re-open the spreadsheet
  2. Or select a single cell containing text, and go through the Text to Columns process, selecting “delimited” but deselecting all delimiters.
Posted in Excel | Tagged , , , , | Leave a comment

A long history of civilisation …

… and climate change:

http://xkcd.com/1732/

earth_temperature_timeline

Posted in Climate, Newton | Tagged , , | 2 Comments

Non-linear Frame Analysis – Scipy solvers

The frame analysis spreadsheet presented in the previous post has been updated to use the solvers included in the Scipy package.  There is now an option to use either the Cholesky solver, or an iterative sparse solver.  The main advantages of this change are:

  1. Cholesky factorisation is the same method as used in the original Fortran code, but the Scipy solver makes better use of multi-core processors, and is significantly faster for large frames.
  2. For very large frames the iterative sparse solver provides much better performance, and will work with much larger frames without hitting memory limits.

In addition to linking to the Scipy functions it was necessary to modify the format of the stiffness matrix.  The Cholesky function uses a lower triangle banded format, and the sparse solver uses a COO sparse format (see the Scipy manual for details).  Using Python to generate these matrices was found to be very slow, so short Fortran routines were added to the main module.

As before, the new spreadsheet and related files, including full open source code, may be downloaded from:

NonLin-Frame.zip

See the previous post for details of software required, and installation details.

In addition to the 3D frame with 1476 beams used in the previous post, two larger frames were analysed, with 7065 beams:

nl-frame2-1

and 14130 beams:nl-frame2-2

For the frame used in the previous post the new solvers made little difference to performance, but with the first of the larger frames the time for the first iteration using the Fortran solver increased from about half a second to between 15 and 60 seconds, depending on the numbering system.  Using the Scipy Cholesky solver, this was reduced to about 1 second for the first iteration (including the matrix factorisation stage), and about 0.5 seconds for each subsequent iterations, allowing iterative solution of 8 non-linear load stages in abut 90 seconds:

nl-frame2-3

As before, beam shears and moments were compared with results from the Strand7 package, showing good agreement:

nl-frame2-4

With the largest frame the first iteration using the Cholesky solver took about 60 seconds, but the sparse solver took only 3 seconds:nl-frame2-5

Posted in Arrays, Beam Bending, Excel, Finite Element Analysis, Fortran, Frame Analysis, Link to dll, Link to Python, Newton, NumPy and SciPy, Strand7, UDFs, VBA | Tagged , , , , , , , , , , , , , | 1 Comment