
Another data conversion option offered by the latest xlwings release is Pandas dataframes and dataseries. This post will look at how to pass an Excel range as a dataframe or dataseries in a User Defined Function (UDF), and some simple statistical applications, but this is barely scratching the surface of the potential of the Pandas Python Data Analysis Library.
To use the Pandas data structures, import pandas and xlwings; the data type can then be defined with an xw.arg decorator:
import pandas as pd
import xlwings as xw

@xw.arg('datrange', pd.DataFrame, index = 0, header = 0)
def rtnpdframe(datrange):
    return datrange

@xw.arg('datrange', pd.Series, header = 0)
def rtnpdseries(datrange):
    return datrange
The Python functions can then be called from VBA:
Function GetDFrame(DRange As Variant)
On Error GoTo rtnerr:
    GetDFrame = Py.CallUDF(ModName, "rtnpdframe", Array(DRange), ThisWorkbook)
    Exit Function
rtnerr:
    GetDFrame = Err.Description
End Function

Function GetDSeries(DRange As Variant)
On Error GoTo rtnerr:
    GetDSeries = Py.CallUDF(ModName, "rtnpdseries", Array(DRange), ThisWorkbook)
    Exit Function
rtnerr:
    GetDSeries = Err.Description
End Function
Use of these functions is shown in the screenshots below:

The xl_Corr UDF shown above is taken from the xlwings documentation:
@xw.func
@xw.arg('x', pd.DataFrame, index=False, header=False)
@xw.ret(index=False, header=False)
def xl_Correl(x):
    return x.corr()
I have added a simple extension to allow an Excel UDF to call any of the dataframe methods:
@xw.func
@xw.arg('x', pd.DataFrame, index=False, header=False)
@xw.ret(index=False, header=False)
def xl_Stats(x, stat):
    method = getattr(x, stat)
    return method()
Use of this UDF with four different statistics functions is shown below. In these examples the statistic is a single value, and the results for each of the three columns of the input range are returned as a single column with three rows.

The “describe” method returns 8 values for each column in the input range:

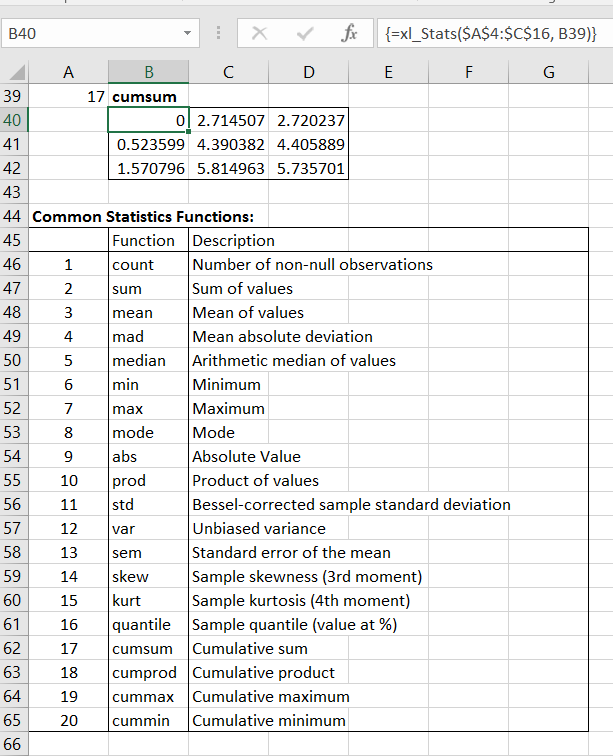
The Pandas documentation lists 20 common statistics functions available as dataframe methods. The screenshot below shows the use of the xl_Stats UDF, in conjunction with the Index function to call any of these 20 functions. In the example shown the cumsum function returns one row for each row of the input data (only the first three are shown):
The functions shown above have been added to:
xlwDict.zip
available for free download, with full open source code.

Pingback: xlwSciPy 1.7 | Newton Excel Bach, not (just) an Excel Blog
Hello, thank you very much. Its very helpful. I have done this cumsum UDF.
import pandas as pd
@xw.func
@xw.arg(‘x’, pd.DataFrame, index=False, header=False)
@xw.ret(index=False, header=False)
def xl_Correl_1(x):
return x.cumsum()
Do you think that there is any chance to modify this function to make calculation with numbers with many decimal places, using mpmath, or decimal?
Suppose I will need to do cumsum on numbers like this:
1.41421356237309504880168872421
1.41421356237309504880168872421
2.82842712474619009760337744842
4.24264068711928514640506617263
LikeLike
As with your other query, you would have to enter the numbers in Excel as text strings, and transfer them to Python as text, then convert them to a suitable precision number format for the calculations, then back to a string for transfer back to Excel.
I am not sure if Pandas dataframes have any restrictions on the number format. I’d suggest checking that before spending too much time on it.
LikeLike
I see, this one works in python
# Import pandas package
import pandas as pd
# import decimal library
from decimal import *
# set the number of decima places
getcontext().prec = 30
# create df from dictionary
df = pd.DataFrame({‘num’: [2, 2, 2, 2, 2, 2, 2, 2]})
#apply decimals on one column
df[‘num’] = df[‘num’].apply(Decimal)
# print results
print(df.cumsum().ffill())
LikeLike