Following the recent post on the Python lru_cache function (Python functools and the Fibonacci Sequence) I have had a look at using lru_cache in the 3DFrame-py spreadsheet. So far using lru_cache in this code has provided little to no speed improvement, but I did find changes to the basic code that resulted in very significant improvements. These are incorporated in the new release, that can be downloaded from:
See Installing 3DFrame-py for installation details, and details of other Python modules required. Also see Python and pyxll for details of the required pyxll package, including a coupon code for a 10% discount.
The most significant change is to the code to calculate beam fixed end actions under the applied loading. The original code allowed for beams with spring end releases at one or both ends, but for beams without end releases much simpler procedures are possible, and the new code applies the simplified procedures wherever possible. The processing time for a very large frame with different code and conditions is shown below:
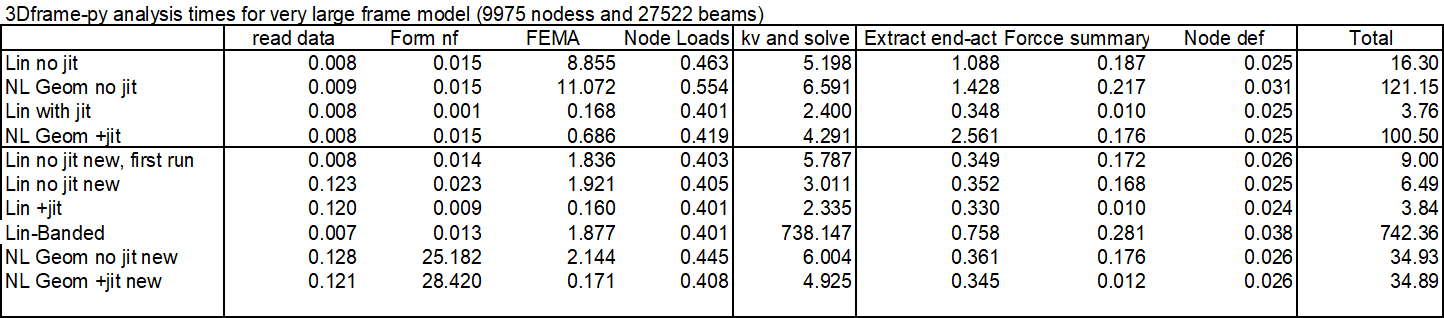
The main conclusions are:
- Total run time for linear analysis with “no jit” code was reduced by half, with the majority of the speed improvement in the code for Fixed End Moment Array (FEMA).
- Using the Numba jit code, the old code was already fast, and this code was not updated.
- For the analyses including non-linear geometric effects the total analysis times were almost the same for the new non-jit code, and the code with jit. The reasons for this are to be investigated.
- One linear run used the “banded” solver. This was very slow, increasing the total solution time to over 12 minutes!
- All the other runs used the PyPardiso solver, which is much faster than any of the Scipy solvers, but also has a further significant speed-up if an analysis is re-run without changing the stiffness matrix. This has the potential to speed up non-linear analyses, which will be investigated in future releases.
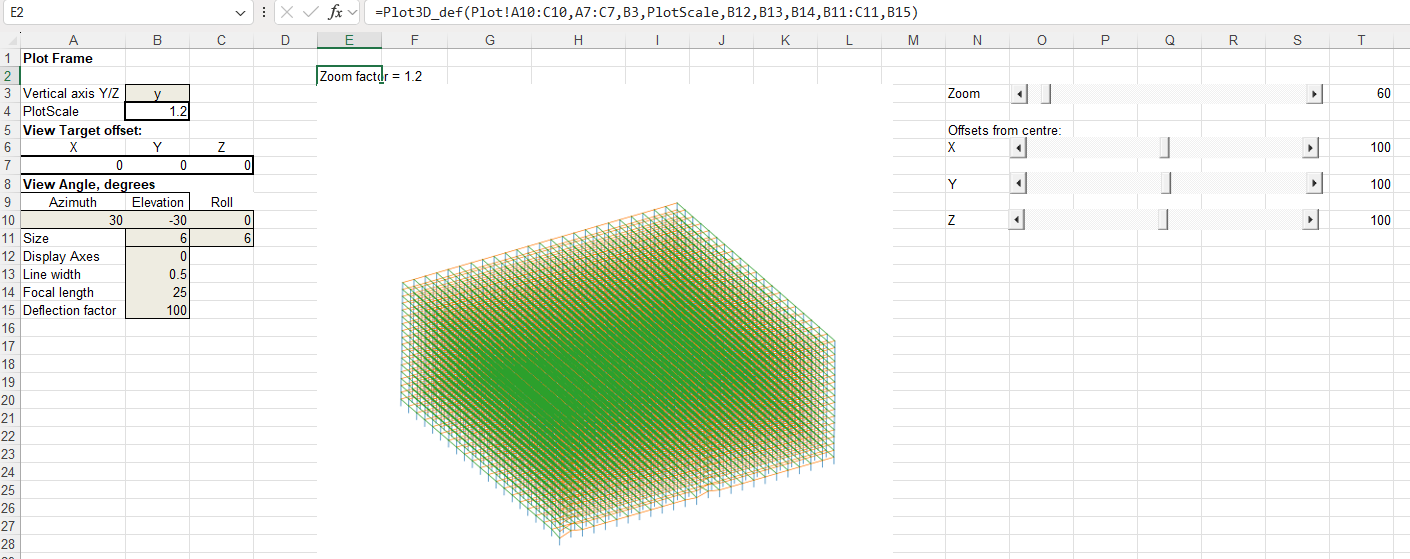
The other main change in the new code is that the VBA code to plot the frame in 3D has been replaced with Python code linking to my Plot3D function (see 3D plots with the latest Matplotlib). This has similar functionality to the VBA code but:
- The Python code is very much faster. Redrawing the full frame for this large model with the VBA code took over 10 minutes. This is reduced to less than 1 second with Python.
- The input data ranges are now selected automatically, and the plot re-draws automatically when anything is changed.
- I have added slider bars to adjust the zoom ratio and the centre of view coordinates.
The full frame, with deflections magnified by 100 times:
Zoom in and pan down to the front corner of the frame:
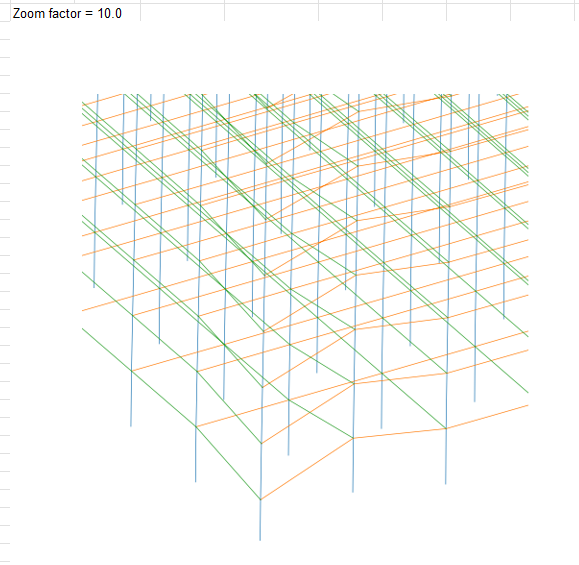
Increase the deflection factor to 200 x:

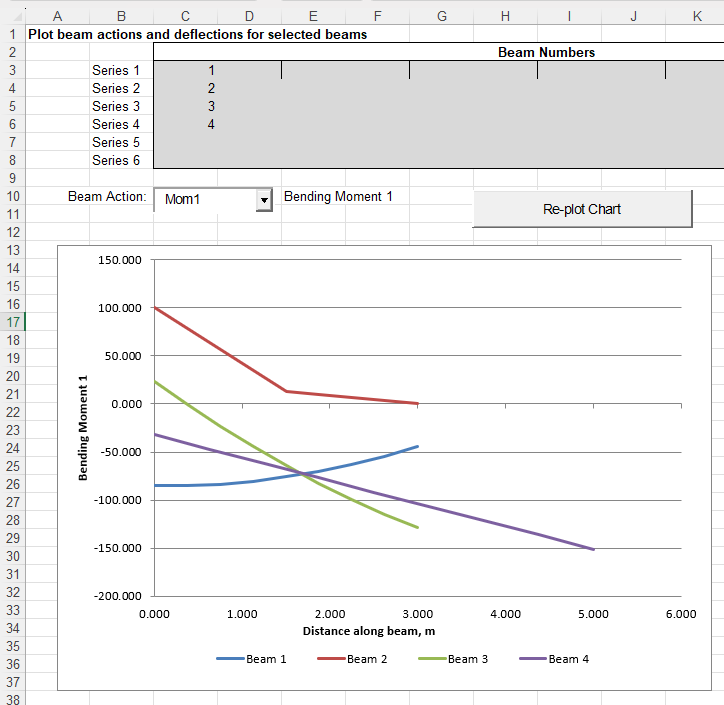
The graph to plot selected beam actions or deflections has also been updated (but currently still uses VBA):