
Following a question here I have compared tabulated coefficients for deflections and bending moments in a rectangular plate with results of a Strand7 analysis using 8 noded plate/shell elements. The results are summarised below, and in a spreadsheet which also includes copies of the tabular data:
Plate def res
The sources of the tables were:
- Theory of Plates and Shells by Timoshenko and Woinowsky-Krieger Download
- Roark’s Formulas for Stress and Strain
- Formulas for Stress, Strain, and Structural Matrices by W.D. Pilkey
- The B.O.R Engineering Monograph No. 27 by W.T. Moody Download
For the purposes of comparison, a rectangular steel plate, restrained against deflection and moment on all four sides was analysed with a uniform load of 1 kPa. Dimensions and material properties are shown in the screenshot below, together with the results of the Strand7 analysis:

The factors from the four sources are shown below:
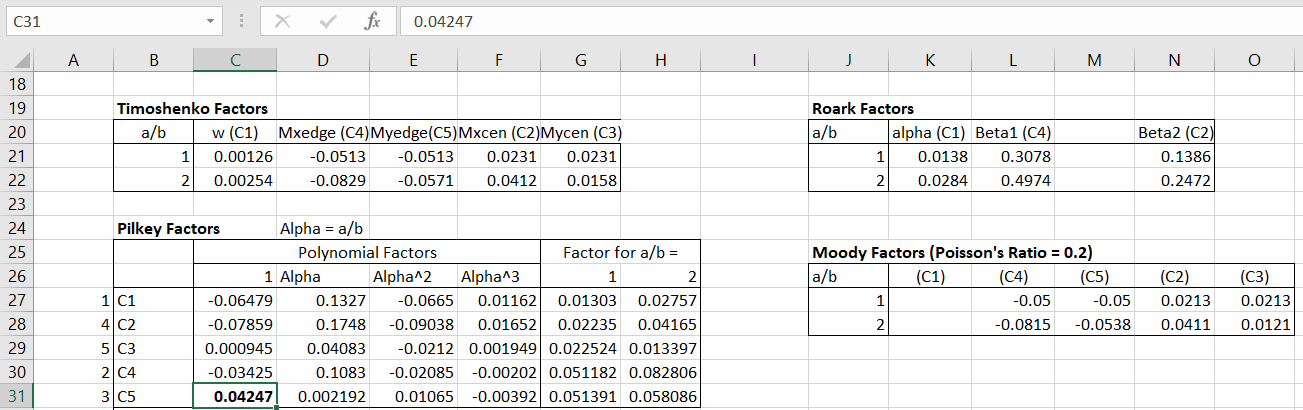
Note that:
- The Pilkey factors are given in the form of a cubic of alpha (a/b)
- The first Pilkey factor for C5 (shown bold) is shown as 0.4247 in the text, but this appears to be an error (10 times too high).
- The Roark and Pilkey factors for deflection incorporate the parameter D, which is applied separately by Timoshenko.
- The Roark factors Beta1 and Beta2 are to calculate stress, rather than bending moment.
- The Moody factors are for reinforced concrete, rather than steel, and are based on a Poisson’s Ratio of 0.2, rather than 0.3.
The deflections and bending moments derived from these factors are shown below for a/b = 1, compared with the Strand7 results: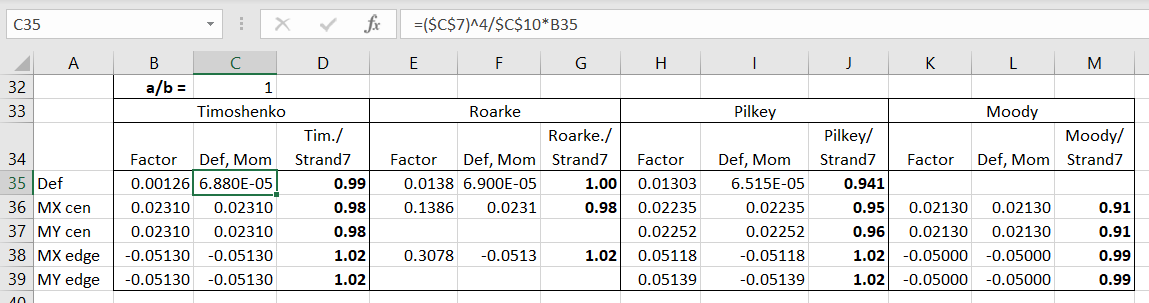
a/b = 2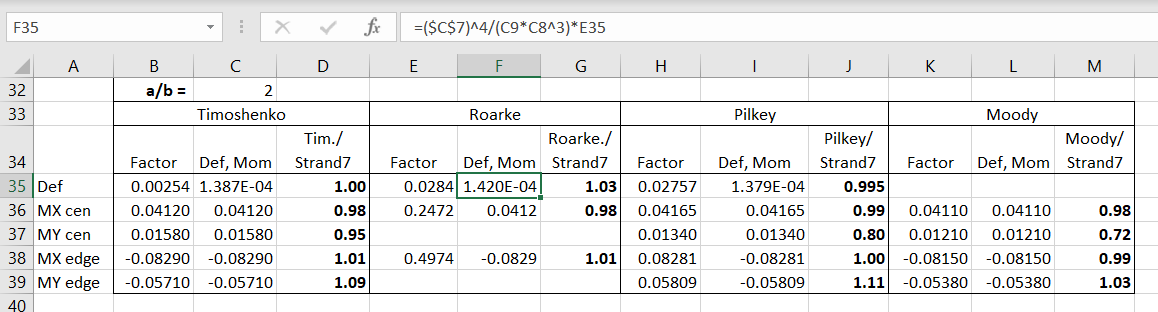
- The Timoshenko deflection results are in good agreement with the Strand7 results, the Roarke deflections are 3% greater than Strand7 for a/b = 2, and the Pilkey deflections are 6% less for a/b =1.
- All the Mx results were within 2% of the Strand7 results, and the Timoshenko and Roark results were in exact agreement with each other, to 3 significant figures.
- There were significant differences in the My results, with Timoshenko moments up to 9% greater than Strand7, Pilkey results up to 11% greater and 20% less, and Moody up to 28% less.
Differences between the Moody results and the other factors are expected, since they are based on a numerical analysis, and used a different Poisson’s ratio, but the differences between the Timoshenko and Pilkey My results are surprising.
The source of the cubic equations defining the Pilkey factors is not given, but it seems likely they are based on fitting a cubic curve to tabulated values over the a/b range of 1 to 2. The source of the tabulated values is not given, but does not appear to be Timoshenko. The screenshot below shows curves fitted to the Timoshenko and Pilkey factors for central Mx, using the Excel Linest function. Although the tabulated coefficients are all within 3%, the coefficients for the fitted cubic curves are very different: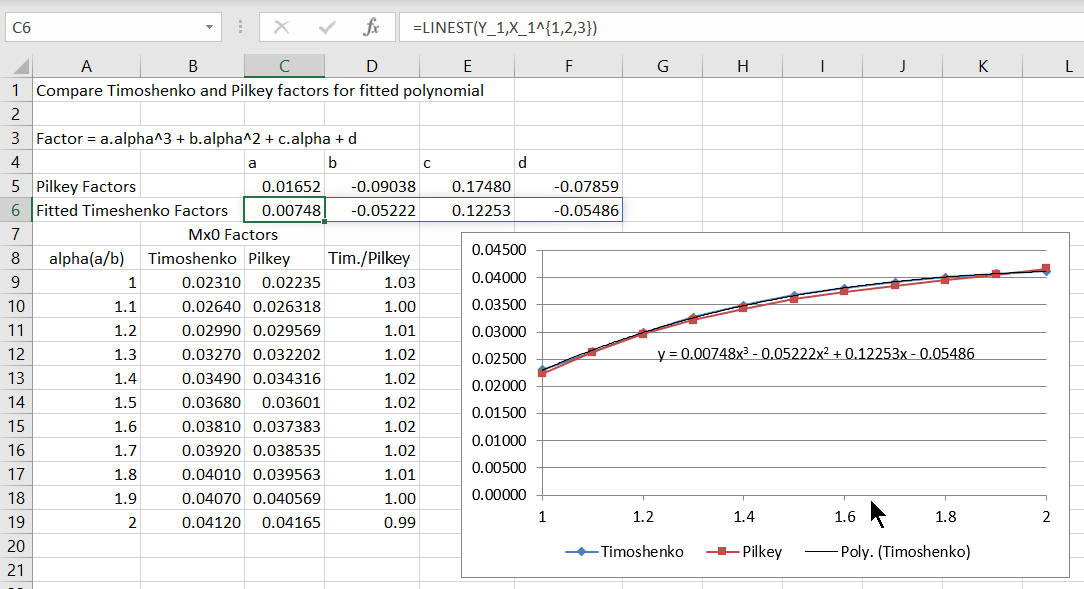

Please update the post with excel sheet mentioned, thank you.
LikeLike
The link is at the end of the first paragraph:
https://newtonexcelbach.files.wordpress.com/2020/08/plate-def-res.xlsx
LikeLike
Instead of uniform load, like to see in the mid of the plate a point Moment M is applied.
Thanks
LikeLike
do you have any reference of bares chart?
LikeLike
What is a bares chart?
LikeLike
can you help me find the equation to get the value of moody’s table?
LikeLike
The fourth dot point near the top of the post has a download for the paper by Moody that I used. That is all the information I have.
LikeLike