
When editing chart ranges, to either change the limits of the range, or select a new column, I have been in the habit of either selecting a range and editing the text in the Formula Edit Bar, or right clicking, choose “select data”, and using the Select Data Dialog.
But there is an easier way:
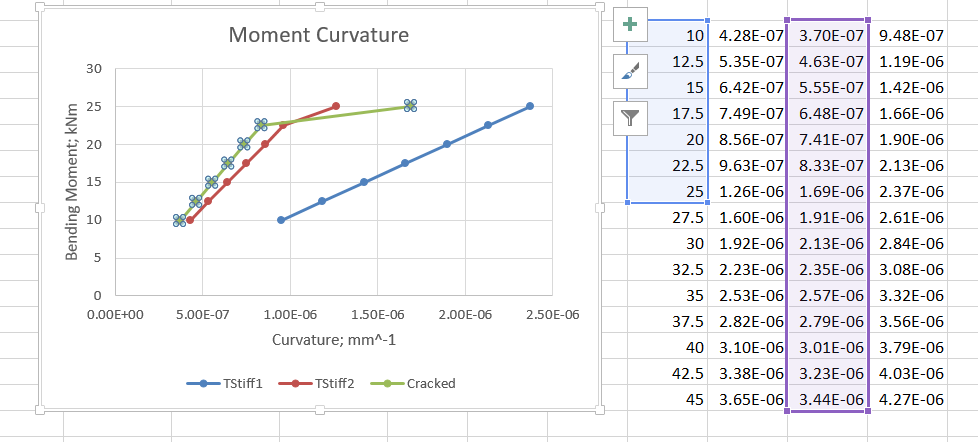
Select a graph range and the data columns are highlighted:

The ranges can now be extended by simply dragging the corner to the required row:
The selected column can then be dragged across to another column:

Repeat for each data range:

and the job is done.

Long gone is also applying Goal Seek by dragging a point in a chart.
Chopped out when Excel 2007 was introduced
LikeLike
Hi Hui. I never actually used that one (having come from many years of Lotus 123, which didn’t have that feature). I’m not actually sure I like the idea of dragging points on charts changing data. Could you switch it off?
LikeLike
I can’t remember if you could turn it off
As soon as you dragged a point it brought up the Goal Seek dialog
a quick Cancel or Escape fixed it
LikeLike
That’s a shame. Moving points on a chart by dragging with the mouse is exactly what I would like to do! Let me know if there’s a still a way …
LikeLike