
In late 2017 I posted Section Properties with MeshPY, including torsion and warping which looked at an Excel front end for Robbie van Leeuwen’s SectionProperties program, which provides facilities for calculation of section properties of complex shapes, including torsion and warping constants. Since then the development has moved to Github and there have been many updates to the code. I have now revised my spreadsheet and Python code to work with the latest version (1.08) and Python 3, using pyxll to link to the SectionProperties Python code:
As well as the spreadsheet and Python code in the download zip file, the following code is required to be installed:
- Python 3.9 and associated code, including Numpy and Matplotlib.
- Pyxll
- Section-Properties 1.08
- Meshpy
With Windows 10 and Python 3.9 I found that Meshpy installed with pip with no problems, but installing Section-Properties with pip raised repeated errors. However simply downloading the code from GitHub, then copying the top level “sectionproperties” folder to my active pyxll code folder worked with no problems. (Update: installing with pip now works well, see SectionProperties update update)
The Excel spreadsheet provides access to the numerical section properties output for any of the 18 pre-defined shapes, or any custom shape. At this stage the graphical output is limited to plots of the geometry of the shapes. The next version of Section-Properties will be switching from Meshpy to the Triangle library for generation of the section meshes, and when that is released I will look at extending the plotting functionality in the spreadsheet.
The screenshots below show examples of the output with the current code:
The first example is taken from the Section-Properties docs, with a hard-coded circular shape of diameter 50, divided into 64 segments. The results are compared with results from the Strand7 FEA package with the same shape:

The next example reads the section “points” and “facets” from the spreadsheet, and divides the shape into two regions, with different specified mesh-sizes:

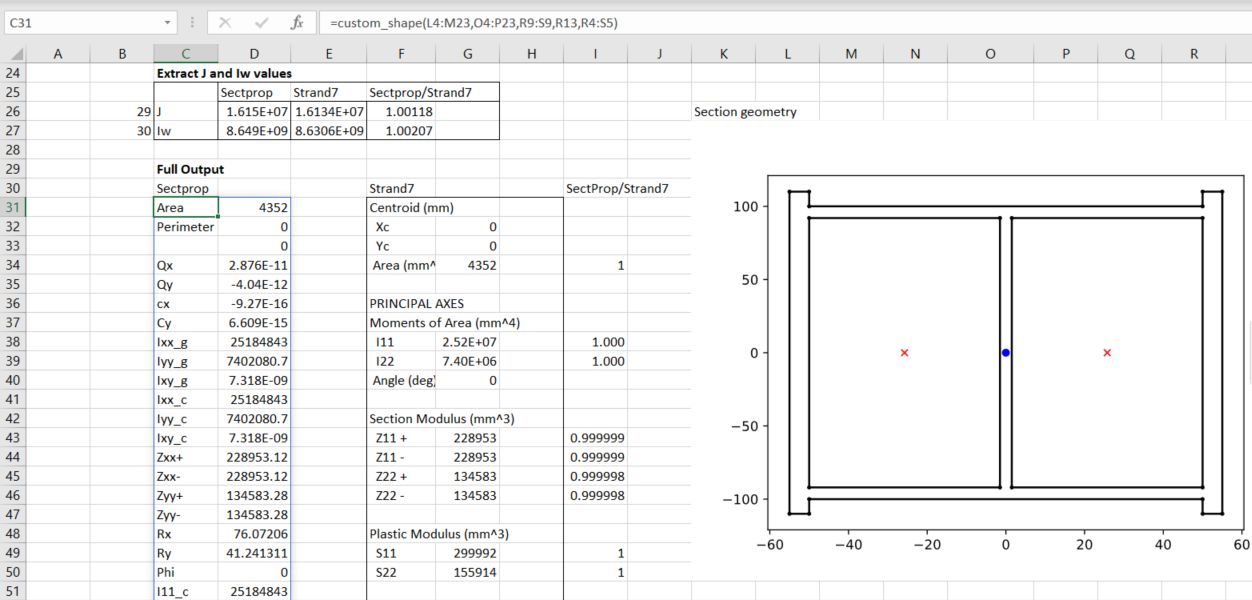
The next sheet generates a shape from an Eng-Tips discussion:

The calculated section properties are compared with values from a Strand7 analysis, with very close agreement:
The Defined_Shapes sheet lists the 18 defined shapes, and uses the GetSect function to generate the section properties for a named shape. The full output list 64 properties, or an array of row numbers may be input to list the selected properties:

The cross-section graphic is generated with the same function, setting the final “out” argument to 10:


Pingback: SectionProperties update update | Newton Excel Bach, not (just) an Excel Blog