Pi day of the Century

In North America, where today is 3-14-15, it is Pi day, and since there are not 31 days in April, the rest of us have to go along with that as well.

Not only is it Pi day, it’s the best approximation to Pi we will get for the next 100 years, because the year ends in 15.

To mark the occasion I have set up a spreadsheet to calculate pi by drawing random lines, based on blog posts by Excel Hero, Hui at Chandoo.org, and also by Hui, another one from Excel Hero.

My spreadsheet is similar to Hui’s “hot-dog” throwing method, but since computers can throw lines much more accurately than people, I have adjusted it to produce a different looking chart.

In the spreadsheet I have set up a table to generate 1000 straight lines of length 1, with centre point exactly at X = 0, and Y between -0.5 and +0.5.  The lines have a random angle to the X axis so some will cross the X axis and some won’t.  The approximate value of Pi is given by: Pi = 2*N / X
where N is the total number of lines (1000 in this case) and X is the number of lines that cross the X axis.

The top of the table looks like:

HD-Pi1

Since 1000 lines does not give a very good approximation to Pi I have also written a UDF that will do the same calculation, but much more quickly because it doesn’t write all the line coordinates to the spreadsheet. With 10 million lines it gives a not too bad approximation:

HD-Pi2

If we plot an XY chart showing just the lines that cross the x-axis it forms a reasonable approximation to an ellipse:

HD-Pi3

Whereas the lines that do not cross form a square with a semi-circle at the top and bottom:

HD-Pi4

The spreadsheet may be downloaded from RandPi2.xlsb.

Have a great Pi Day.

Edit, Still Pi Day: I have just discovered that the term Pi was invented by a Welsh Man named William Jones.

Edit 21:40 15 Mar 2015; still Pi Day somewhere*:  I happened to click on an old comment and found a link to: Estimating pi using the MC technique

* The somewhere where it is still Pi day is:

The following countries use GMT-12 as their Time Zone.  NB No Summer Time / Daylight Saving Time is used.

Baker Island: an uninhabited atoll located just north of the equator in the central Pacific Ocean about 3,100 kilometres (1,900 miles) southwest of Honolulu.

Posted in Charts, Excel, Maths, Newton | Tagged , , , , , | 6 Comments

Continuous Beams with Specified Deflections

A few weeks ago there was some discussion in a previous continuous beam post about how to analyse a continuous beam with specified deflections at the supports.  In this post I will look at three different ways of doing this with the current version of the ConbeamU spreadsheet, and in the next I will publish a new version that includes functions to do the job automatically.  The examples included in this post can be downloaded (including full open source code) from: Conbeam-Support Disp.zip

Probably the simplest approach is to use the Excel Solver to adjust the beam model to achieve the desired displacements at the supports.  The procedure in outline is:

  1. Set up a single cell with a formula that will act as a single target value for solver.
  2. Select a range (or separate cells) containing values that Solver will adjust to reach its goal.
  3. Enter starting values in this range.
  4. Open the Solver dialog, specify the required inputs (including any constraints) and run the Solver.

The first screenshot below shows this process with a three span beam, with cantilevers at each end, and specified displacements at each support.  In this example I have adjusted the support stiffness to get the required displacements (click on any image for a full size view):

DDeflect1

This example uses the ConBeamU User Defined Function (UDF) to find the beam deflections (also shear forces and moments) for the beam defined under “Beam Segments” and “Supports”, when subject to the specified Distributed Loads and Point Loads.  Tne main function output is in columns K to N (hidden by the Solver Dialog box), but the deflections at the four supports are extracted with simple formulas in cells K4:K7.  The required deflections are entered in cells J4:J7, and the difference of these two values squared is in L4:L7.  The difference is squared because this will always give a positive value.  In this case the ConBeamU function has been set up to return deflections in mm, but care must be taken to ensure consistent units.  The Solver target value (or “Objective”)  in Cell L8 is the sum of the 4 values in L4:L7.

in the Solver Dialog:

  1. The Objective is specified as the value  in L8
  2. This value is to be set to a value of 0
  3. The values to be adjusted to achieve this target are in the range F6:F9
  4. Each of these values must be greater than zero, because zero or negative values will be treated as a rigid support by the ConBeamU function.

Having set up the Solver, click the Solve button, and the values in F6:F9 will be adjusted until L8 is very close to zero, as shown above.

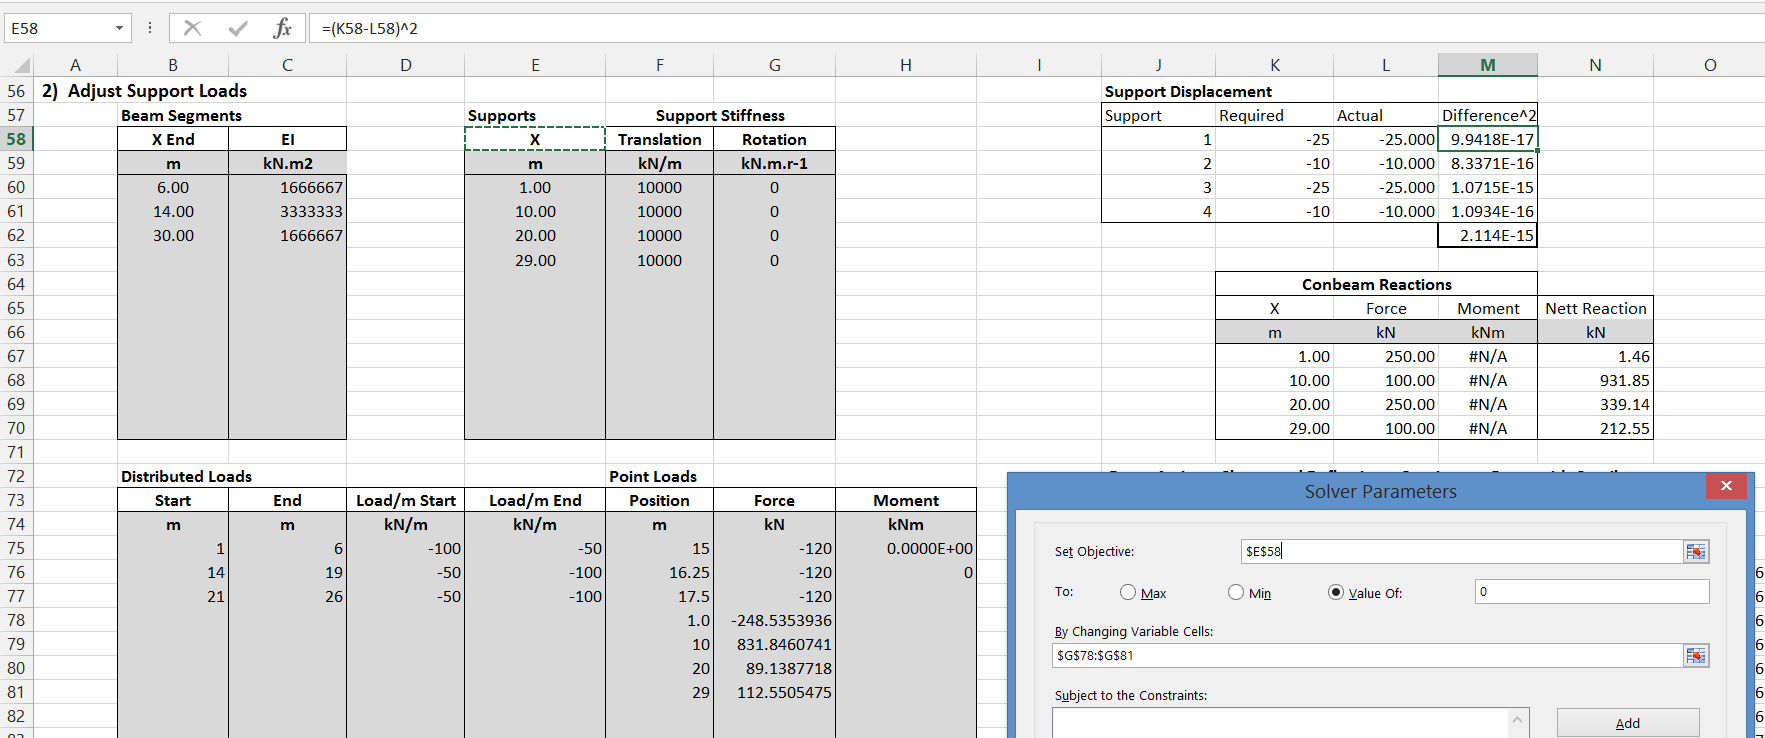
The second example also uses the Solver, but in this case I have set the support stiffness values to a fixed (arbitrary) value, and created an artificial point load at each support:
DDeflect2

The set-up is the same as for the previous example except that:

  1. The “By Changing Variable Cells” range is now the values of the four additional point loads in G78:G81
  2. The constraints to keep all variable values greater than zero are no longer required.
  3. This procedure generates the correct shear forces, moments and deflections, because the artificial loads are applied directly to the supports, but to find the correct reactions the applied support loads must be added to the calculated reactions.

It can be seen (column N) that this method finds exactly the same Nett Reaction forces as the first example.

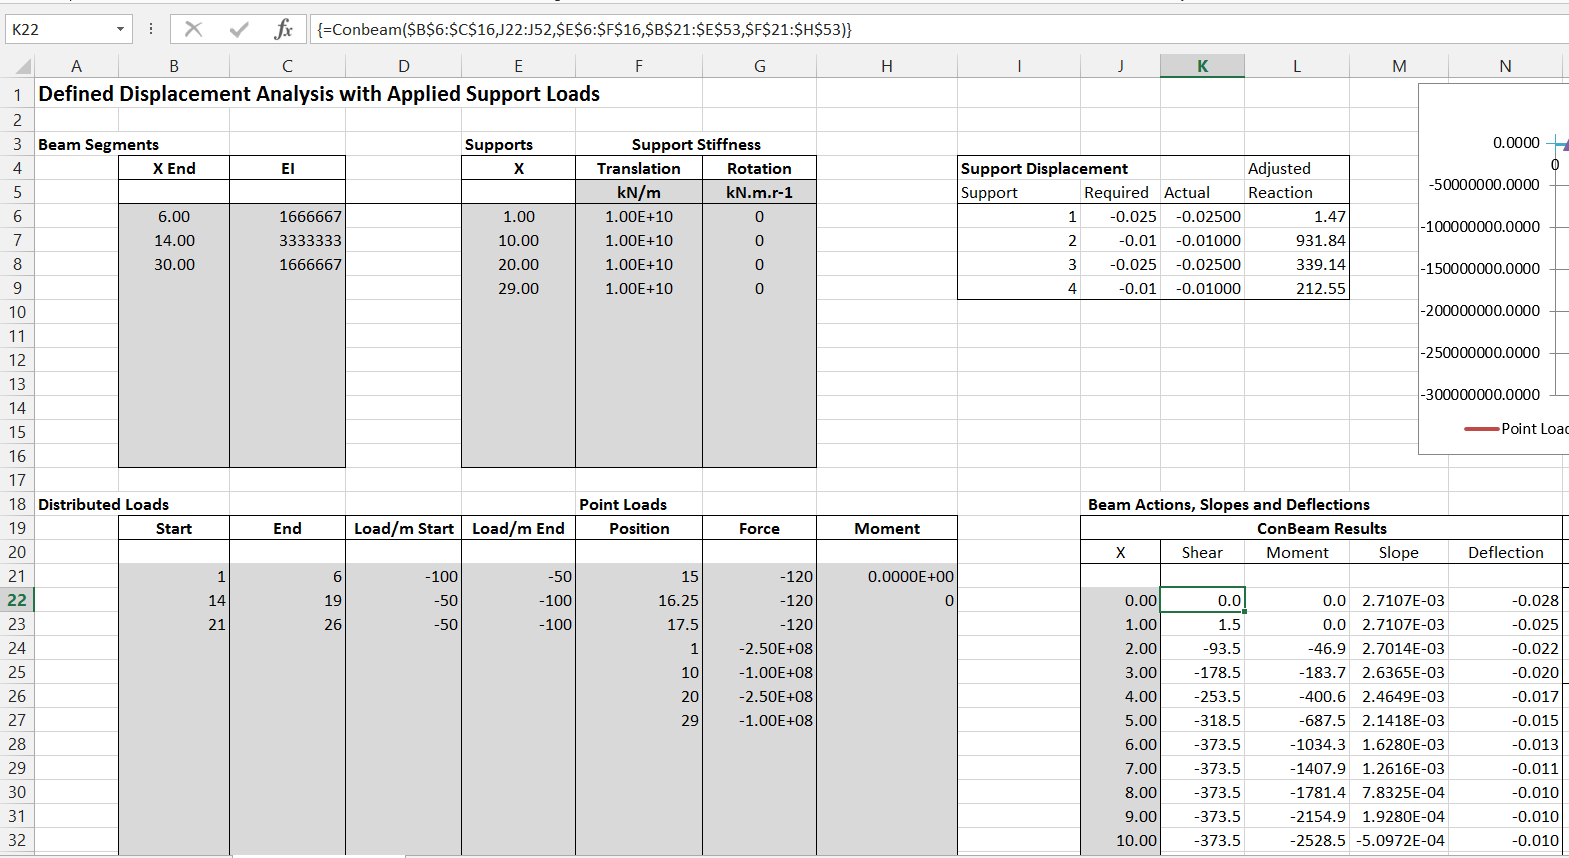
A similar approach, that does not require the use of the Solver, is to make the stiffness of the supports very much greater than the stiffness of the beam, and apply very large vertical point loads at the support positions:
DDeflect3

In the example shown above I have used the ConBeam UDF, which is not unit aware, so deflections are now in metres.  The support stiffness has been set to 1E10 kN/m, and the artificial point loads are 1E10 x required deflection in m (Range G24:G27).  The deflections are calculated immediately, and are a very close approximation to the required values (the maximum error is of the order of 1E-7 m).

To achieve this order of accuracy the stiffness of the supports must be chosen carefully.  If it is too low the relative beam stiffness will affect the results, but if it is too high round-off error has a significant effect.  The best value for any given beam can be found easily by trial and error.

The final method takes longer to set up, but is easily automated and is the one that has been incorporated in the new version of the spreadsheet.  The procedure used in this approach is:

  1. The SSSpanU UDF is used to calculate the beam deflection under the specified (real)loading when supported by the end supports only.
  2. Upward unit loads are applied separately at each internal support, and a flexibility matrix is set up showing the deflection at each node position due to each unit load.
  3. The flexibility matrix is inverted to yield a stiffness matrix.
  4. The stiffness matrix is multiplied by the deflection required at each internal node to return the single span deflections to the specified support deflection.
  5. The resulting values are the internal reaction loads, that may be applied in conjunction with the real applied loads to determine the resultant loads and deflections of the beam.
    DDeflect4

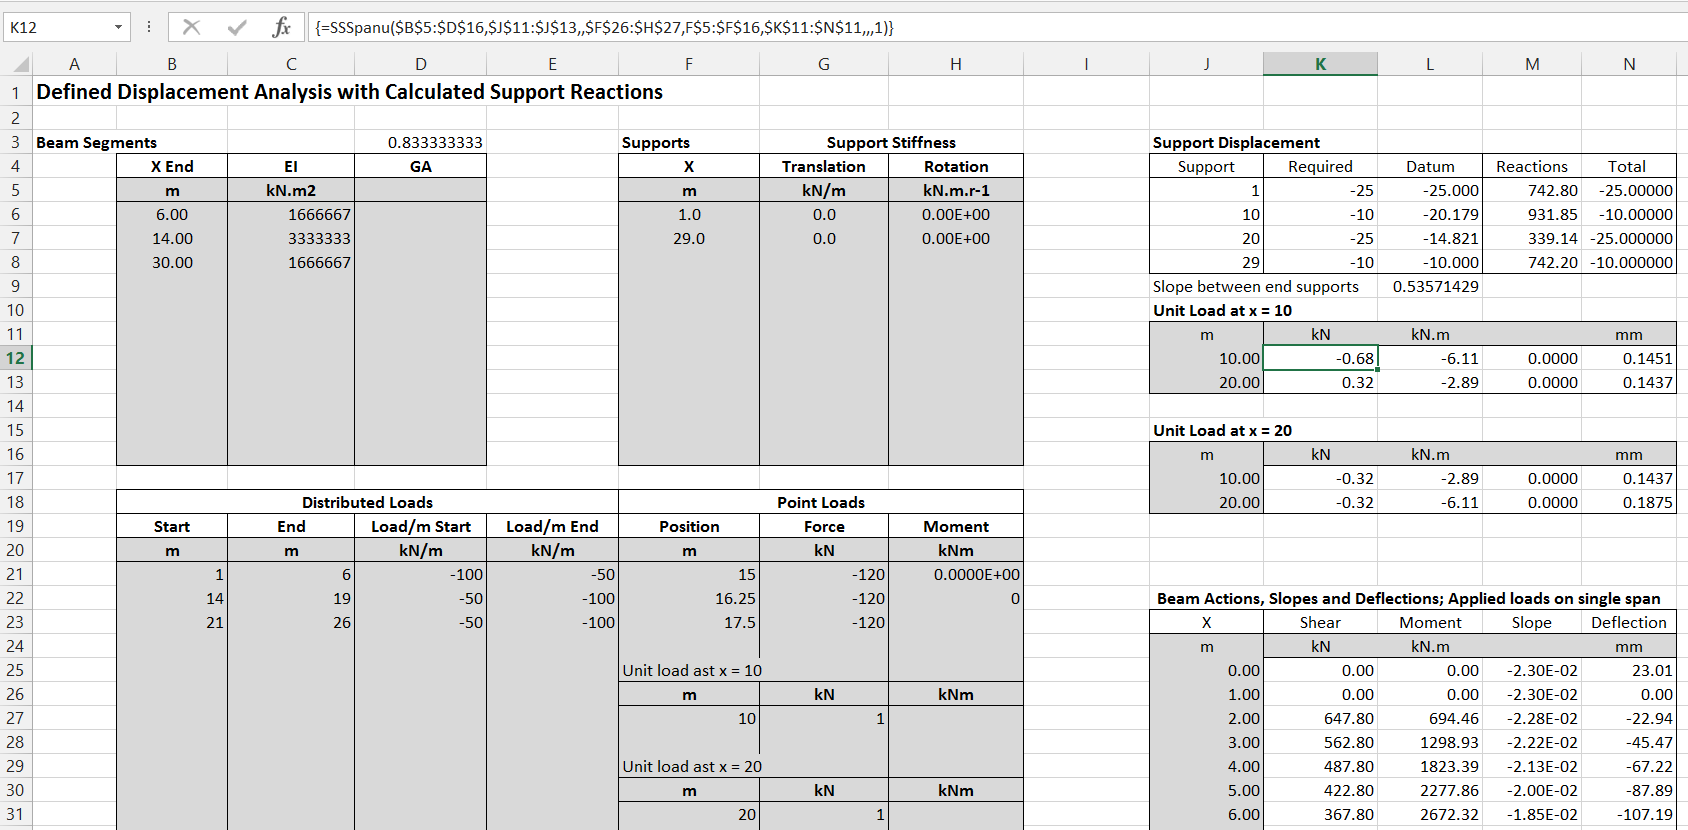
The screenshot above shows the input and results for the three initial calculations:

  1. The end supports are defined in range F5:G7, and the real applied loading is in ranges B20:E23 (distributed loads) and F20:H23 (point loads).
  2. The resulting beam actions and deflections for the single span are in range K24:N55
  3. The applied unit loads at the internal supports are in ranges F26:H27 and F30:H31, and the resulting output at the internal nodes is in ranges K11:N12 and K17:N18.

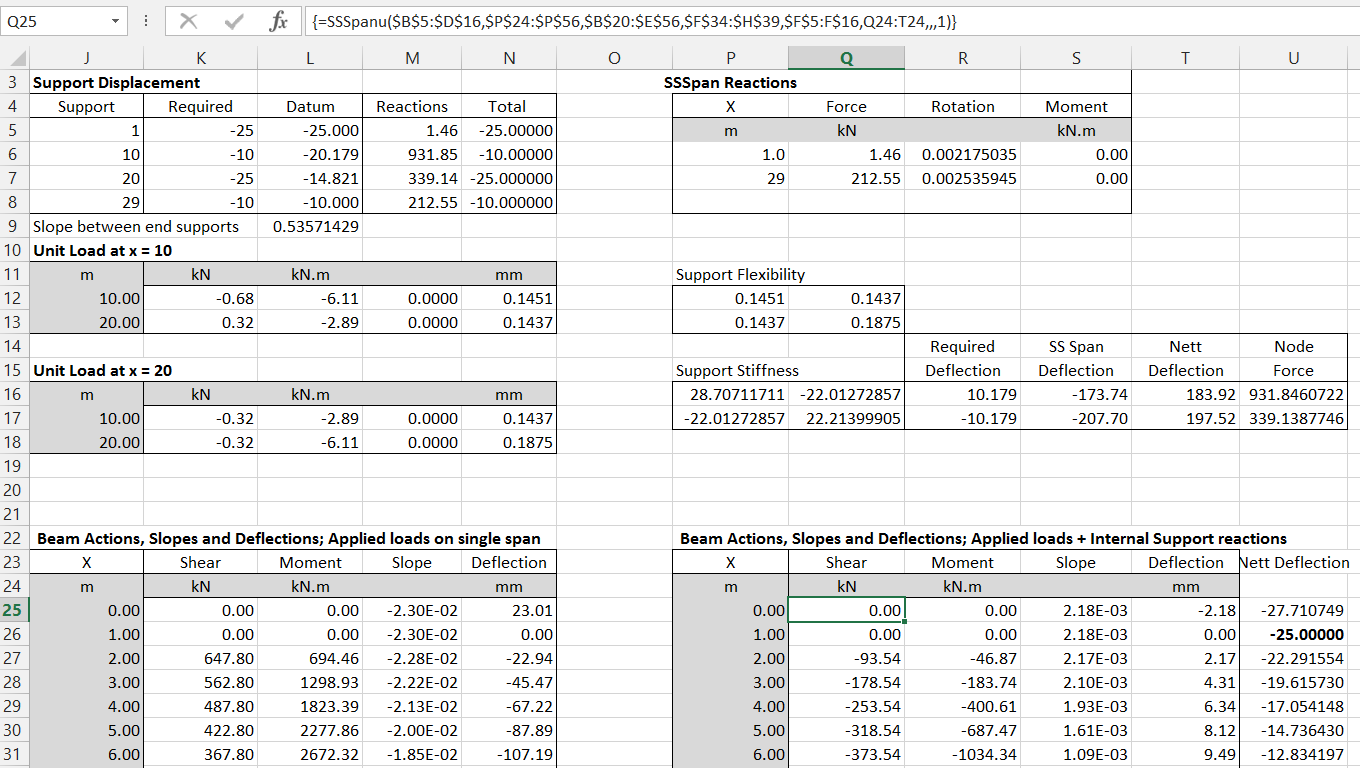
The final stage of the calculations is shown in the screenshot below:
DDeflect5

  1.  The support flexibility matrix is in P12:Q13, being the node deflections from cells, N12, N13 and N17 and N18.
  2. This matrix is inverted in range P16:Q17, using the MInverse function, to generate the support stiffness matrix.
  3. This matrix is then multiplied (using the MMult function) by the required beam deflections to find the support reaction at each internal support.  Note that the required settlements are measured from a datum line between the end supports after settlement.  The settlement of the Datum is shown in L5:L8, and the resulting required deflections at the internal supports at R16:R17.
  4. The internal support reactions are then applied together with the original loading in a single span analysis, with output in range Q25: T55.
  5. Finally the deflections must be adjusted for the deflection of the end nodes, as shown in Column U.  The final reactions and deflections at the supports are also transferred to M5:N8.

The results of the three different analysis methods, applied to a beam with the same loading and specified deflections, are shown in the graphs below, showing virtually identical results from each analysis.

DDeflect6 DDeflect7 DDeflect8

Posted in Excel | Tagged , , , , , | 1 Comment

7 Year Report

As in previous years, I have downloaded the statistics for this blog for the previous year, and pasted them into a worksheet. The link to each post is preserved in the spreadsheet, so it makes a convenient index to what has been posted over the year. The spreadsheet has been uploaded to OneDrive, so you should be able to access the links in the window below, or open the file in your browser or Excel, or download it.

Link not displaying? If you get a blank space above, rather than a Onedrive spreadsheet, please let me know, together with your browser type and version, and Flash version. Thanks

Of the 2014 posts, the most popular overall was The angle between two vectors, Python version

The most popular in the Newton category was Frame Analysis with Excel,

and the most popular in the Bach category was The Deserter

From the “deserving but sadly neglected category” I have chosen (so go and have a look/listen):

Newton: Numerical Integration; Tanh-Sinh Quadrature v. 4.3

Excel: Binary functions, combining text, and finding unique columns

Bach: More from Martin Simpson

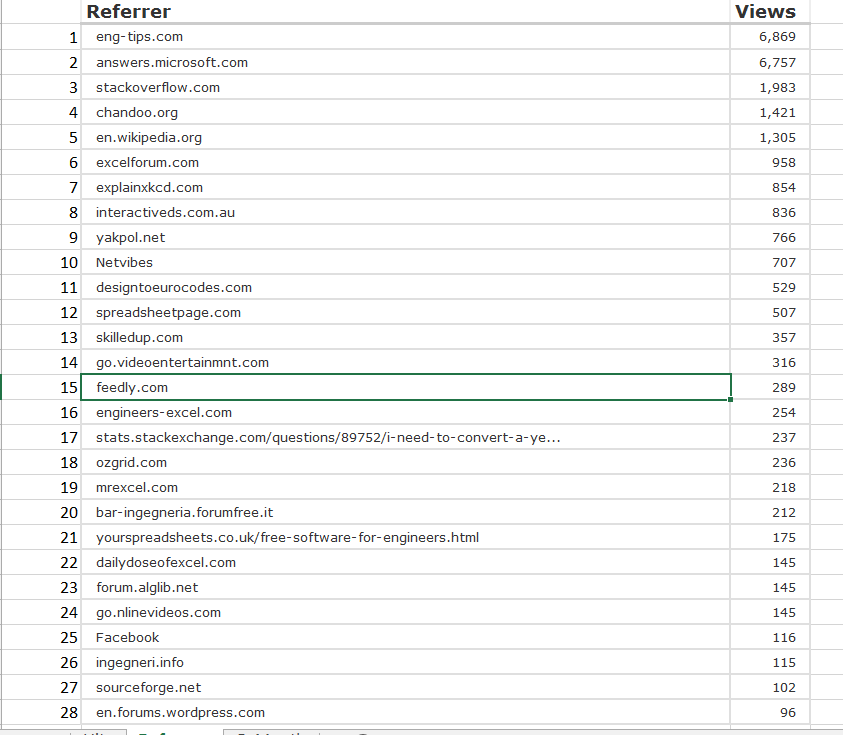
Most frequent referrers to this site came from:

Referrers2014

Posted in Bach, Excel, Newton | Tagged | 2 Comments

Reducing Risk in Structural Concrete Design

The Concrete Institute of Australia is running a series of full day seminars on Structural Concrete Design for Extreme Events in each of the mainland capitals:

See:  Structural Concrete Design for Extreme Events for details of dates and locations in each state.

The aim of these seminars is not just to focus on design for earthquake and fire, but to encourage a focus on a design approach that will reduce the risks arising from all sorts of unexpected events.

In recent years the legal focus on risk reduction has moved from consideration of the possible risks towards a focus on the available precautions, regardless of the probability of the associated risks. The latter approach requires that risks should be eliminated or minimised “so far as is reasonably practicable”, whereas the risk focussed approach requires that the overall risk should be “as low as reasonably practicable”.

The precaution based approach is presented as providing a clear definition of the risk reduction measures that must be taken, but the question remains, how is it to be decided if a given precautionary measure is “reasonably practicable” or not? A precaution based approach has much to commend it, but from the engineer’s perspective it moves the risk minimisation process from one where correct procedures are reasonably well defined in specifications and codes of practice, to one where decisions must be made on the basis of judgement and experience.

The engineer may see it as unfortunate that two radically different approaches towards the minimisation of risks are described by phrases that at face value have identical meanings, but as engineers we must recognise the world as it is, and find ways to deal with it. A precaution based approach to risk minimisation requires not just a thorough knowledge of structural theory and code requirements, but also a knowledge of techniques that will improve the robustness of structures at low cost, and a knowledge of what is considered current best practice.

Regardless of an increased focus on precautionary measures, risk minimisation also continues to require an awareness of the possible risks, a best estimate of their probability, and a knowledge of the likely consequences. This also requires knowledge outside that found in codes of practice, which are necessarily restricted in the scope of their data, and have a significant time lag in incorporating new research and procedures.

The first of the Concrete Institute’s National Seminars this year is entitled “Structural Concrete Design for Extreme Events” and will deliver detailed guidance on designing robust structures that will provide increased resistance to not just earthquakes and fire, but also other infrequent but possibly calamitous events such as impact or blast loading, extreme storm loading, or gross foundation movements.

The seminars will be presented by three of Australia’s leading experts in their respective fields.

  • Professor Stephen Foster is Head of School at the University of New South Wales, and has developed an international reputation for his work on high strength concrete and structural robustness.
  • Professor John Wilson is Executive Dean at Swinburne University and a past president and continuing active member of the Australian Earthquake Engineering Society. He has a long-standing interest in earthquake engineering, structural dynamics and blast engineering.
  • Professor José Torero is Professor of Civil Engineering and Head of School at the University of Queensland, and also has a truly international reputation as a leader in research and education in his area of fire engineering.

These seminars present a rare opportunity to hear from three such distinguished presenters on a subject of essential importance to all practicing structural engineers, and I encourage all to attend.

Posted in Concrete, Newton | Tagged , , , | Leave a comment

Slicing Arrays with VBA

A recent comment asked about the most efficient way to write part of an array to the spreadsheet from VBA. This post looks at three alternative methods which have advantages in different circumstances (thanks to Lori Miller for reminding me of the Index alternative, which I have written about previously, then forgotten about).

Download all the functions discussed in this post from VBIndex.xlsb.

If the source array is in the form of a range object the task can be done very simply with a combination of the Offset and Resize methods:

Function SliceArrayO(DatRange As Variant, TLR As Long, TLC As Long, NumR As Long, NumC As Long) As Variant

    ' Slice an array passed as a range with the Offset method
    ' Ranges are not converted to arrays
    ' No step size argument

    If NumR = 0 Then NumR = DatRange.Rows.Count - TLR + 1
    If NumC = 0 Then NumC = DatRange.Columns.Count - TLC + 1

    SliceArrayO = DatRange.Offset(TLR, TLC).Resize(NumR, NumC)
End Function

An alternative is the worksheet Index function:

Function SliceArrayI(DatRange As Variant, Optional TLR As Long = 1, Optional TLC As Long = 1, _
    Optional NumR As Long = 0, Optional NumC As Long = 0, _
    Optional RowStep As Long = 1, Optional ColStep As Long = 1) As Variant

    Dim i As Long, j As Long, RowA() As Variant, ColA() As Variant
    ' Slice an array passed as a range using the Index function
    ' Optional step size argument

    If NumR = 0 Then
        NumR = DatRange.Rows.Count - TLR + 1
        If RowStep > 1 Then NumR = Int((NumR - 1) / RowStep) + 1
    End If
    If NumC = 0 Then
        NumC = DatRange.Columns.Count - TLC + 1
        If ColStep > 1 Then NumC = Int((NumC - 1) / ColStep) + 1
    End If
    ReDim RowA(1 To NumR)
    ReDim ColA(1 To NumC)

    If RowStep > 1 Then NumR = 1 + (NumR - 1) * RowStep
    If ColStep > 1 Then NumC = 1 + (NumC - 1) * ColStep

    j = 0
    For i = 1 To NumR Step RowStep
        j = j + 1
        RowA(j) = Array(TLR + i - 1)
    Next i

    j = 0
    For i = 1 To NumC Step ColStep
        j = j + 1
        ColA(j) = TLC + i - 1
    Next i

    SliceArrayI = Application.Index(DatRange, RowA, ColA)
End Function

Note that the array defining the rows in the output array (RowA) must be an array of arrays.
This procedure has the advantage that it is possible to specify a step for the output rows and columns, so that for instance every other row may be output. Also the input array may be either a range or a variant array.

A third alternative is to simply loop through the input array, and copy selected values to a new array:

Function SliceArrayV(DatRange As Variant, Optional TLR As Long = 1, Optional TLC As Long = 1, _
    Optional NumR As Long = 0, Optional NumC As Long = 0, _
    Optional RowStep As Long = 1, Optional ColStep As Long = 1) As Variant

    Dim i As Long, j As Long, m As Long, n As Long, NewA() As Variant
    ' Slice an array passed as a range or variant array with a double loop
    ' Ranges are not converted to arrays
    ' Optional step size argument

    If TypeName(DatRange) = "Range" Then
        If NumR = 0 Then
            NumR = DatRange.Rows.Count - TLR + 1
            If RowStep > 1 Then NumR = Int((NumR - 1) / RowStep) + 1
        End If
        If NumC = 0 Then
            NumC = DatRange.Columns.Count - TLC + 1
            If ColStep > 1 Then NumC = Int((NumC - 1) / ColStep) + 1
        End If
    Else
        If NumR = 0 Then
            NumR = UBound(DatRange) - TLR + 1
            If RowStep > 1 Then NumR = Int((NumR - 1) / RowStep) + 1
        End If
        If NumC = 0 Then
            NumC = UBound(DatRange, 2) - TLC + 1
            If ColStep > 1 Then NumC = Int((NumC - 1) / ColStep) + 1
        End If
    End If

    ReDim NewA(1 To NumR, 1 To NumC)

    If RowStep > 1 Then NumR = 1 + (NumR - 1) * RowStep
    If ColStep > 1 Then NumC = 1 + (NumC - 1) * ColStep

    m = 0
    For i = 1 To NumR Step RowStep
        m = m + 1
        n = 0
        For j = 1 To NumC Step ColStep
            n = n + 1
            NewA(m, n) = DatRange(TLR + i - 1, TLC + j - 1)
        Next j
    Next i

    SliceArrayV = NewA
End Function

This code will also work on an array passed as either a Range object or a variant array, and allows a step size to be specified for the output array. As a possibly faster variation, the alternative code below converts an input range to a variant array before extracting the data. The option for step sizes has been removed from this version, to keep the code as simple as possible:

Function SliceArrayV2(DatRange As Variant, Optional TLR As Long = 1, Optional TLC As Long = 1, _
    Optional NumR As Long = 0, Optional NumC As Long = 0) As Variant

    Dim i As Long, j As Long, NewA() As Variant
    ' Slice an array passed as a range or variant array with a double loop
    ' Ranges are converted to arrays
    ' No step size argument

    If TypeName(DatRange) = "Range" Then DatRange = DatRange.Value2
    If NumR = 0 Then NumR = UBound(DatRange) - TLR + 1
    If NumC = 0 Then NumC = UBound(DatRange, 2) - TLC + 1

    ReDim NewA(1 To NumR, 1 To NumC)

    For i = 1 To NumR
        For j = 1 To NumC
            NewA(i, j) = DatRange(TLR + i - 1, TLC + j - 1)
        Next j
    Next i

    SliceArrayV2 = NewA
End Function

Finally, I have written a “front-end” function that selects the most appropriate function to use, of the four available, based on some benchmark tests described later.  The SliceA function works as follows:

  • If it is passed a variant array (rather than a range object) it calls SliceArrayV2 if there is no step size specified for the output, or SliceArrayV for row or column steps (or both) greater than 1.
  • If it is passed a range object it calls SliceArrayO if there are no steps in the output, or SliceArrayI if there are.
Function SliceA(DatRange As Variant, Optional TLR As Long = 1, Optional TLC As Long = 1, _
    Optional NumR As Long = 0, Optional NumC As Long = 0, _
    Optional RowStep As Long = 1, Optional ColStep As Long = 1) As Variant
    Dim i As Long, j As Long, RowA() As Variant, ColA() As Variant
    ' Call one of four Slice functions, depending on input and output types

    If RowStep = 0 Then RowStep = 1
    If ColStep = 0 Then ColStep = 1

    If TypeName(DatRange) <> "Range" Then
        If RowStep = 1 And ColStep = 1 Then
            SliceA = SliceArrayV2(DatRange, TLR, TLC, NumR, NumC)
        Else
            SliceA = SliceArrayV(DatRange, TLR, TLC, NumR, NumC, RowStep, ColStep)
        End If
    ElseIf RowStep = 1 And ColStep = 1 Then
        SliceA = SliceArrayO(DatRange, TLR - 1, TLC - 1, NumR, NumC)
    Else
        SliceA = SliceArrayI(DatRange, TLR, TLC, NumR, NumC, RowStep, ColStep)
    End If
End Function

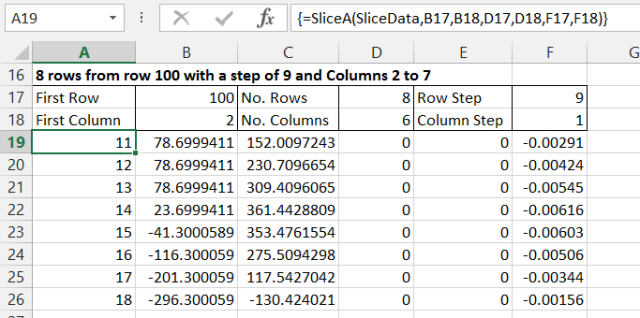
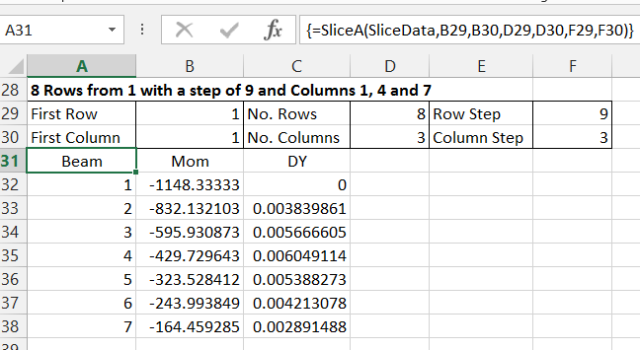
Examples of the use of the SliceA function as a User Defined Function (UDF) are shown in the screen shots below.  In each case the data is extracted from a range with 8 columns and 262 rows:
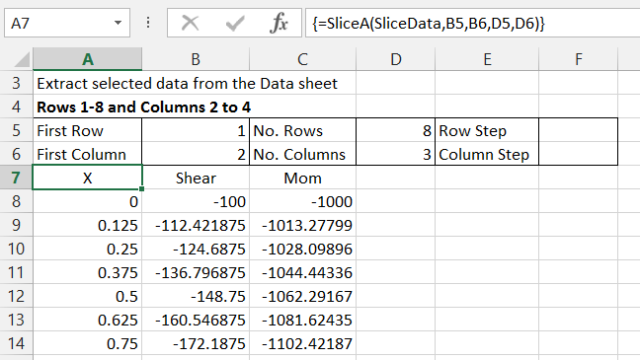
SliceA1
SliceA2
SliceA3

Benchmark results for the slicing functions under different conditions are shown in the tables below.  For each case there are 11 different results:

  • 1: SliceArrayI (using the index function) passed a range object.
  • 2-4: SliceArrayV (using a double loop) 1) passed a variant array, 2) range converted to array, then passed to the function, 3) passed a range object.
  • 5-7: SliceArrayV2 (modified double loop) with the same three cases as above.
  • 8: SliceArrayO (using the Offset method) passed a range object.
  • 9-11: SliceA with the same 3 cases as SliceArrayV and SliceArrayV2

The first case was 1000 iterations extracting a 5×5 array from a 10×10 array:
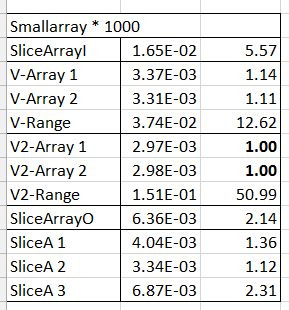
SliceA4

For a small array the functions looping through an array were significantly faster than those that operated on a range, but when passed a range these functions were significantly slower.  Of the two functions operating on a range, SliceArrayO was significantly faster than SliceArrayI.  The SliceA function was only marginally slower than the best case for each of the three variations.

The second case was 100 iterations extracting a 5×5 array from a medium sized array (1000 x 10)
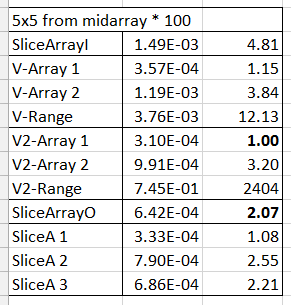
SliceA5

These results are similar to the first case, except that SliceArrayV2 passed a range is now three orders of magnitude slower than when passed a variant array.

The third case was 10 iterations extracting a 5×5 array from a large array (5000 x 1000)
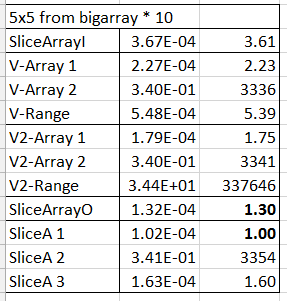
SliceA6

Operating on a large range the functions that convert the range to an array have become much slower than the others.  Note that even though this operation is only repeated 10 times, V2-Range is more than 100 times slower than V2-Array 2, which performs the range to array operation only once.

The next case extracted a 500×500 array from the same large array as before (5000×1000)
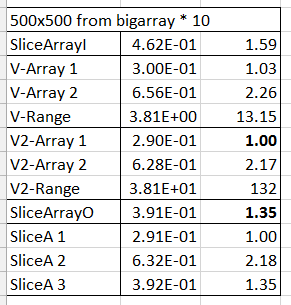
SliceA7

Relative times are in the same order, but the relative differences are much smaller.

Finally a small array was extracted from near the end of the large array, again repeated 10 times.
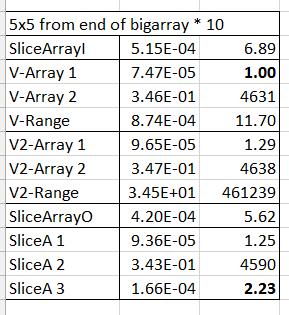
SliceA8

For this case the functions operating on range objects were significantly slower, whereas those operating on arrays were as fast or faster.  Those functions requiring the conversion of a range object to a variant array were again very slow, especially when this operation was repeated 10 times, resulting in an execution time about 100 times slower than the function otherwise following the same operations, and almost 500,000 times slower than the fastest function.

In summary:

  • When operating on arrays, the looping functions were significantly faster on small arrays, and had similar performance on very large arrays.
  • When operating on range objects the SliceArrayO function (using the offset method) was significantly faster than using the Index function.  Both were significantly faster than looping on a range method, and hugely faster than converting the range to a variant array, especially for large arrays.
  • The SliceA function performed close to the best timing, except when conversion of a large range to an array (outside the function) was included in the timing.
Posted in Arrays, Excel, UDFs, VBA | Tagged , , , , , | 7 Comments