
I have posted here previously a spreadsheet that allows XY data to be extracted from images of graphs, maps or other images of objects in a single plane: How to digitise a scanned image.
I have updated the instructions for the procedure to cover Excel’s new dynamic array feature, which can return an array of data from a function entered in a single cell. The new version can be downloaded from:
DigitGraph2.zip

I also recently discovered the Webplot Digitizer program, that can either be used on-line, or as a download. The download is free (with no advertising), with a button for voluntary donations. The screen-shot below shows the downloaded version. The program is considerably more sophisticated than my spreadsheet, providing not only a magnified image of the graph at the cursor location, but also allowing the option of either manual selection of data points, or a fully automated process to detect the graph line(s) and generate the data points.
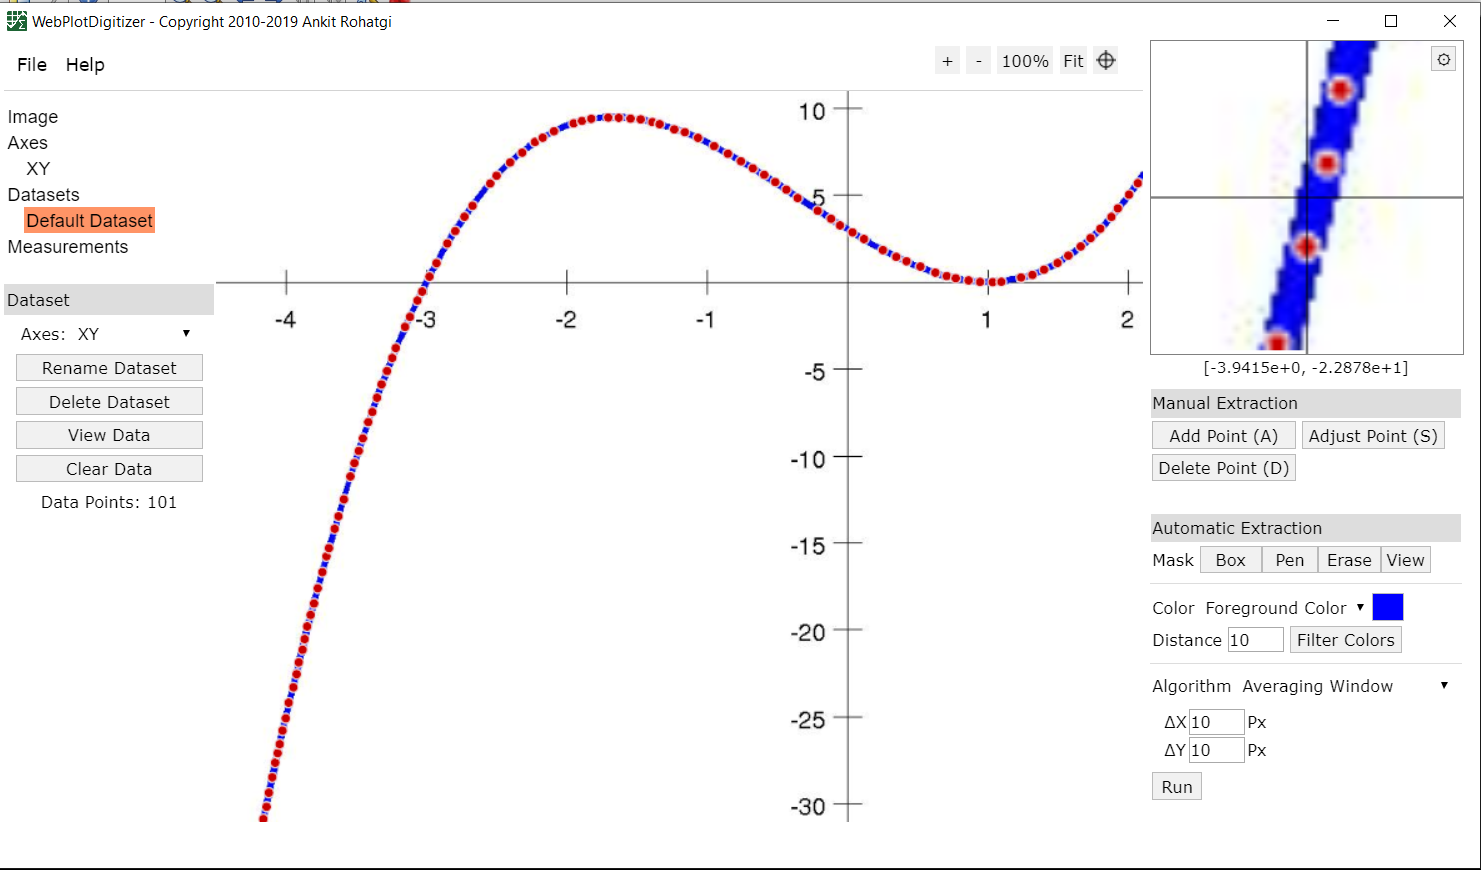
Output from the WebPlot program (both manual and automated) is shown below plotted together with output from my Digitgraph function, showing close agreement for all three lines.


great contribution. Thanks
LikeLike
Another option is Enguage Digitizer, http://markummitchell.github.io/engauge-digitizer/. I’ve used it off and on for many years.
LikeLike
Thanks Paul, I’ll have a look.
LikeLike
Wow. I’m going to try and see if this works for the PCA slab-on-grade method charts. I wonder if it will handle multi-line graphs.
LikeLike
I haven’t tried multi-line graphs, but the auto line detection uses the line colour, so if all the lines are the same colour I imagine it might have problems.
But the manual method would have no problem at all, other than being a bit tedious.
LikeLike
Hi Doug… it’s time to disclose here that Excel+VBA alone (no human intervention aside pressing a button) can now get the data of the graph. Not even one color, I can get a full set of colours (for any given number of series). I can say that my procedure includes:
And I should say that a SOTA AI model will nail all these steps in just a bunch of prompts. In the end will be no more than 1-1.2k lines of code, with no external dependencies. I have not worked a lot on the axis issue (I mean to detect the axis and the numbers there…) but I will also say that is PERFECTLY attained with:
LikeLike