On line until 19 September 2015 only.
But after that listen to the music by Damien Lane

When editing chart ranges, to either change the limits of the range, or select a new column, I have been in the habit of either selecting a range and editing the text in the Formula Edit Bar, or right clicking, choose “select data”, and using the Select Data Dialog.
But there is an easier way:
Select a graph range and the data columns are highlighted:

The ranges can now be extended by simply dragging the corner to the required row:
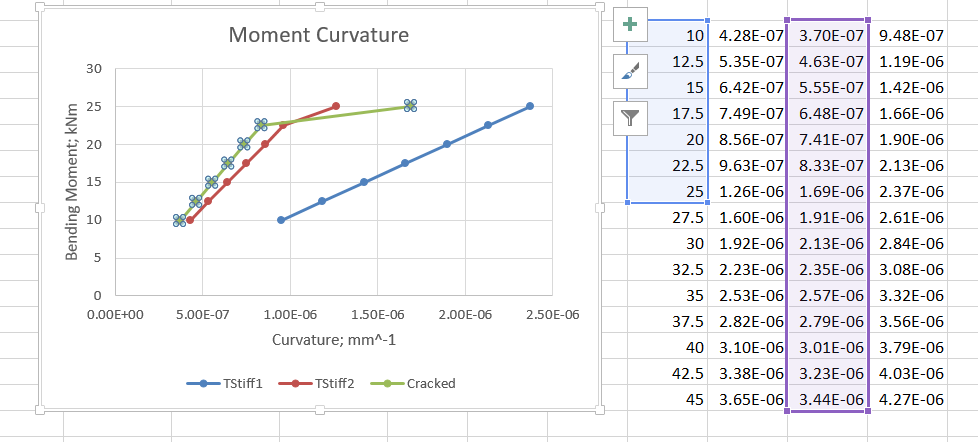
The selected column can then be dragged across to another column:

Repeat for each data range:

and the job is done.
The IP2 spreadsheet provides functions to calculate:
Since the last release:
The new version may be downloaded from IP2.zip (including full open source code).
The Python functions require Python and Numpy to be installed. Then simply copy the contents of the zip file to any convenient directory.
I recently noticed that in the RC Design Functions spreadsheet the TimeCurve function had stopped working. The function calculates the development of reinforced concrete section curvature over time, and was previously presented in Reinforced Concrete Moment-Curvature – 3; Restrained Shrinkage and Creep and Reinforced Concrete Moment-Curvature – 4; Development of curvature over time.
In the course of fixing the problem I took the opportunity to add some further refinements:
The updated spreadsheet (including full open-source code) may be downloaded from:
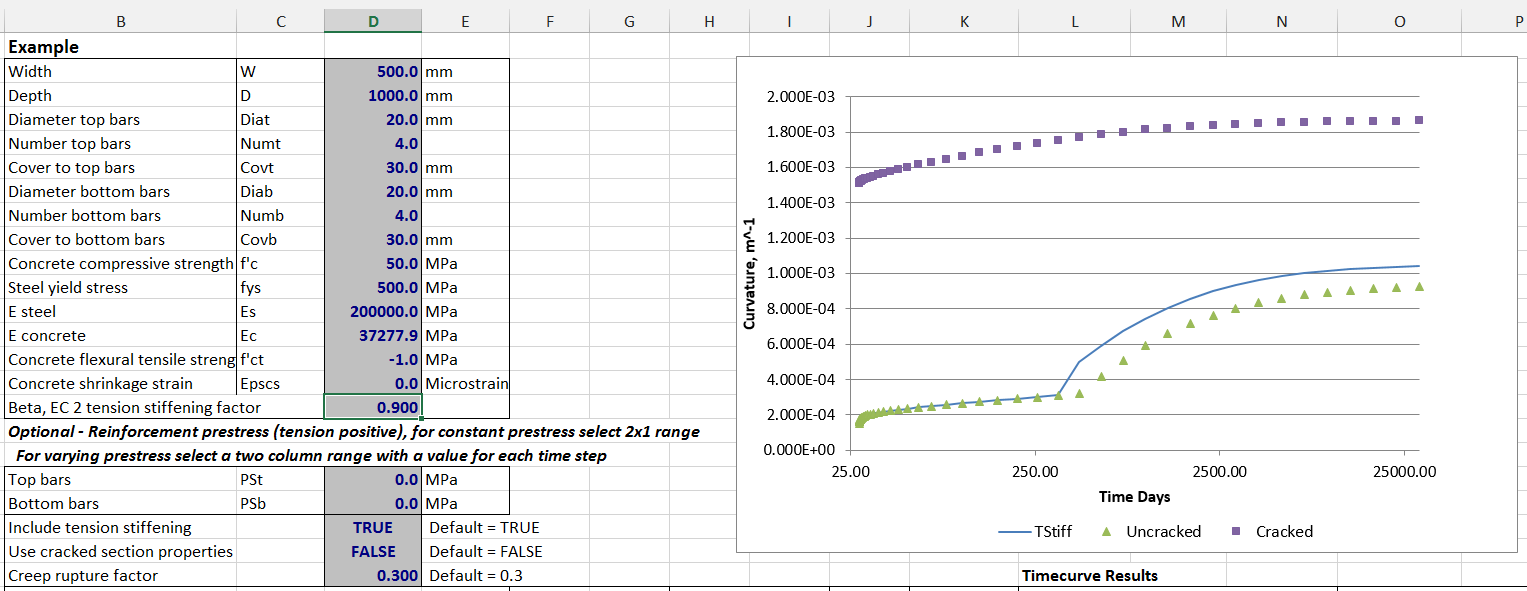
Examples of the function results, compared with experimental data, will be included in the next post on this subject. The screen-shots below show input and results for a typical beam loaded to just below the cracking moment, with cracking occurring as a result of the combined action of shrinkage and creep. Click any image for a full-size version:
Function input documentation:

Typical section properties input and output graph:
Time related data input:
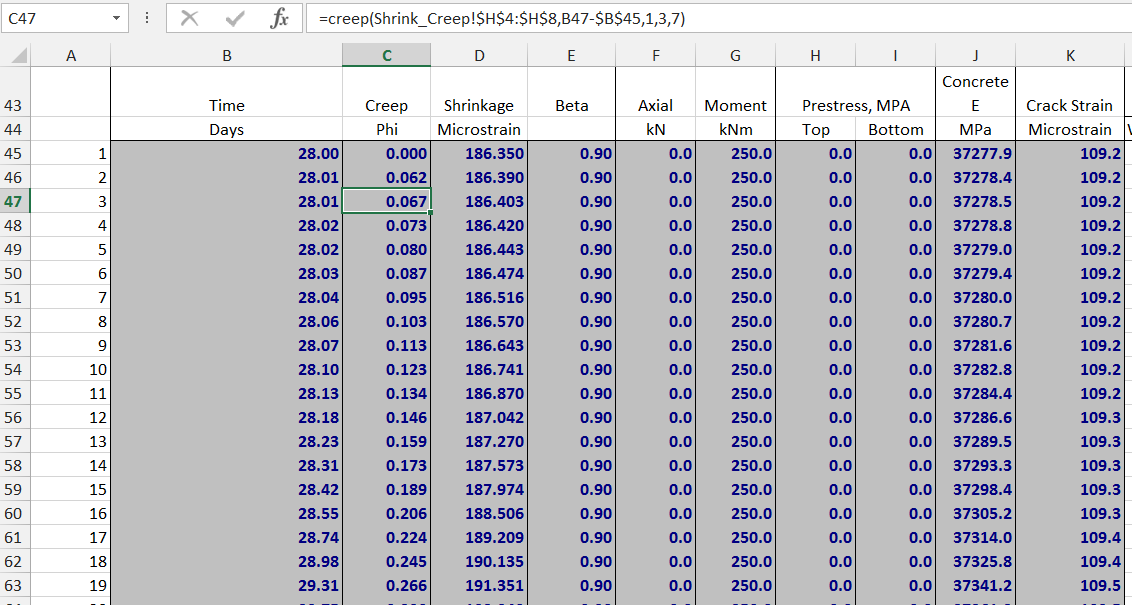
Note that the function may be used anywhere in the spreadsheet. To display all the results it must be entered as an array function, using Ctrl-Shift-Enter. See Using Array Functions and UDFs for details.
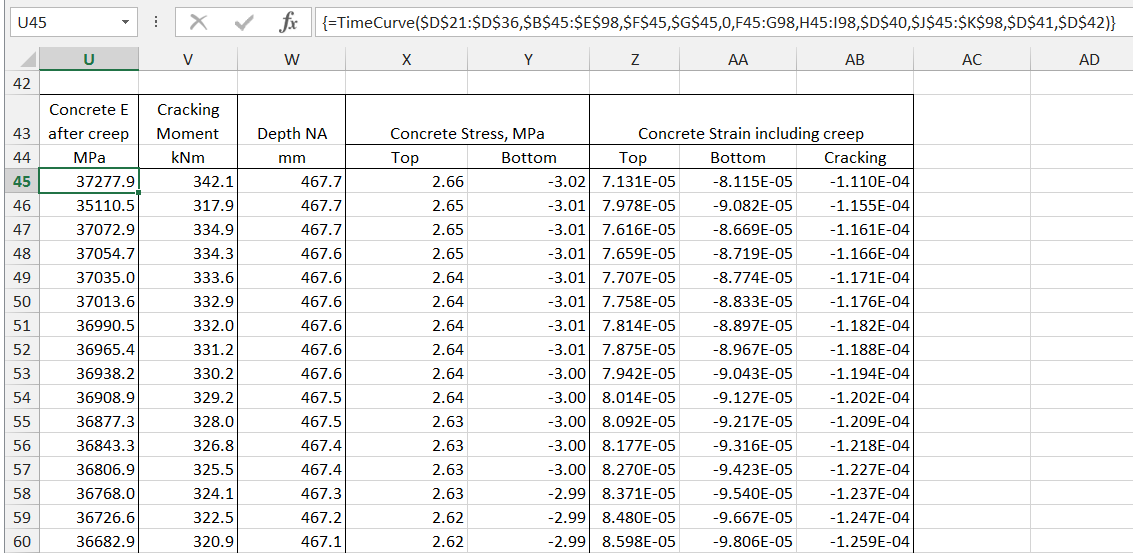
Output results columns 1 to 9:
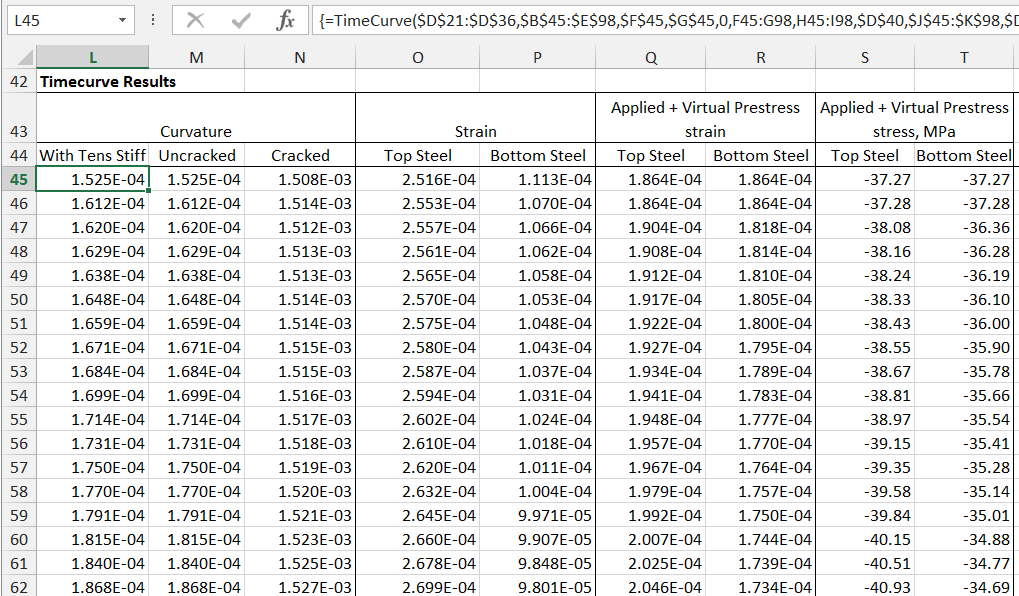
Output results columns 10 to 17: