Drawing in Excel-3

Previous post
OK, here are some of the promised basics of using VBA to create drawings in Excel.

This and following posts will cover:

  • The shape objects and how to create them
  • How to select, group, and delete shapes
  • How to modify existing shapes
  • How to get the properties of existing shapes
  • How to scale shapes
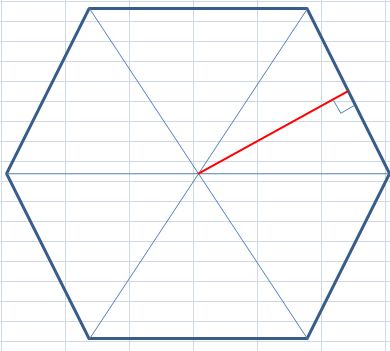
  • How to create 3D perspective wireframe drawings

There are two main problems with creating code driven drawings in Excel:

  • There are several alternative ways to do almost everything, and the ways they work are not always obvious (at least to me), and there are significant difference between versions.
  • The documentation is sparse, and what there is is often far from helpful.  To make matters worse, there is little on the subject in the popular Excel books, and even web sites covering the topic are few and far between.

In the rest of this post I will list the available VBA methods that apply to shape objects, then look at some examples of how these methods work in practice.

The methods applicable to shapes are:

  • AddCallout
  • AddChart
  • AddConnector
  • AddCurve
  • AddFormControl
  • AddLabel
  • AddLine
  • AddOLEObject
  • AddPicture
  • AddPolyline
  • AddShape
  • AddTextbox
  • AddTextEffect
  • BuildFreeform
  • SelectAll

The ones I will be concentrating on are:

  • AddCurve
  • AddLine
  • AddPolyline
  • AddShape
  • AddTextbox

Which will give us more than enough for what we want to do.

The examples given below can be found in: Plot Shapes.zip

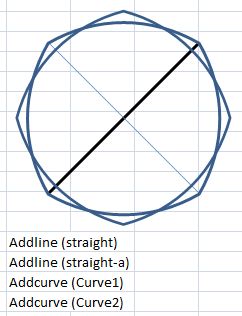
The examples are based on drawing similar dodecagons (regular 12 sided polygons) by various methods.  The coordinates defining the shapes are listed on the spreadsheet, we will be looking at how screen coordinates work more closely in a later post.  For now just note that the shapes are defined by 12 x,y coordinates, with the first point repeated at the end of the list, to create a closed shape.  There are also 4 straight lines, defined by the start and end points.


Sub ExShapeAdd()
Dim PointArray() As Single, CoordA As Variant, shp As Shape, i As Long, ffshp As Shape
Dim myBuilder As FreeformBuilder, XNode As Single, YNode As Single

ShapeDelete ‘Routine to delete old shapes, see later post
CoordA = [a1:b13] ‘ Get coordinates array from the worksheet

‘ AddLine
With ActiveSheet.Shapes.AddLine(CoordA(1, 1), CoordA(1, 2), CoordA(7, 1), CoordA(7, 2))
.Name = “straight”
.Line.Weight = 2
.Line.ForeColor.SchemeColor = 8
End With

‘Plot the same line and rotate through 45 degrees
With ActiveSheet.Shapes.AddLine(CoordA(1, 1), CoordA(1, 2), CoordA(7, 1), CoordA(7, 2))
.Name = “straight-a”
.Rotation = 90
End With

‘ Copy CoordA (variant) into PointArray (single)
ReDim PointArray(1 To 13, 1 To 2)
For i = 1 To 13
PointArray(i, 1) = CoordA(i, 1)
PointArray(i, 2) = CoordA(i, 2)
Next i

‘ AddCurve
Set shp = ActiveSheet.Shapes.AddCurve(PointArray)
With shp
.Fill.Visible = False
.Name = “Curve1”
End With
With ActiveSheet.Shapes.AddCurve(PointArray)
.Fill.Visible = False
.Rotation = 45
.Name = “Curve2”
End With

AddCurve

AddCurve


CoordA = [a15:b27]
' AddShape; 183 = straight connector
ActiveSheet.Shapes.AddShape(183, CoordA(7, 1), CoordA(1, 2), CoordA(1, 1) - CoordA(7, 1), CoordA(7, 2) - CoordA(1, 2)).Name = "Straight2"
With ActiveSheet.Shapes.AddShape(183, CoordA(7, 1), CoordA(1, 2), CoordA(1, 1) - CoordA(7, 1), CoordA(7, 2) - CoordA(1, 2))
.Name = "Straight2-A"
.Rotation = 90
End With

For i = 1 To 13
PointArray(i, 1) = CoordA(i, 1)
PointArray(i, 2) = CoordA(i, 2)
Next i

‘ AddPolyLine
ActiveSheet.Shapes.AddPolyline(PointArray).Fill.Visible = False

AddPolyLine

AddPolyLine


CoordA = [a29:b41]
For i = 1 To 13
PointArray(i, 1) = CoordA(i, 1)
PointArray(i, 2) = CoordA(i, 2)
Next i

‘ Shapebuilder
‘ first point
XNode = PointArray(1, 1)
YNode = PointArray(1, 2)
Set myBuilder = ActiveSheet.Shapes.BuildFreeform(msoEditingAuto, XNode, YNode)
‘ remaining points
For i = 2 To 13
XNode = PointArray(i, 1)
YNode = PointArray(i, 2)
myBuilder.AddNodes msoSegmentLine, msoEditingAuto, XNode, YNode
Next

Set ffshp = myBuilder.ConvertToShape
ffshp.Name = “Built-shape”

BuilFreeForm

BuilFreeForm


CoordA = [a44:a47]
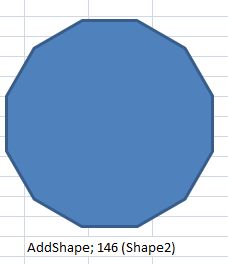
' AddShape; 146 = dodecagon
ActiveSheet.Shapes.AddShape(146, CoordA(1, 1), CoordA(2, 1), CoordA(3, 1), CoordA(4, 1)).Name = "Shape2"

End Sub

AddShape

Next post

Posted in Drawing, Excel | Tagged , , , | 6 Comments

Elegant proofs 2 – The area of a circle

We are so familiar with the formula for the area enclosed by a circle that we tend not to think much about how it was derived, at least I don’t.

The proofs of the formula are in fact many and varied; the first one found by Google is at:
http://www.artofproblemsolving.com/LaTeX/Examples/AreaOfACircle.pdf

Don’t worry, that’s not the elegant one.

There are many proofs that don’t (directly) involve the use of calculus, and Wikipedia gives a good sample of them:

http://en.wikipedia.org/wiki/Area_of_a_disk

of which the rearrangement proof is perhaps the most elegant.  Another presentation of this proof is given here (along with Archimedes’ equally elegant derivation of the volume of a sphere):

http://www.mathreference.com/geo,circle.html

Yesterday I came across an approach that to me seems even simpler, based on a post at:

http://foxmath.wordpress.com/2008/06/24/perimeter-area/

The apothem of a hexagonThis shows that for any regular polygon with an area equal to its circumference, the length of the apothem (the red line in the diagram to the left) is 2.  This is immediately obvious from the fact that the area of each individual triangle is equal to the base length, when the height equals 2.

In the limit as the number of sides of a regular polygon tends to infinity the polygon approaches a circle, and the length of the apothem approaches the radius of the enclosing circle.  It therefore follows that the area of a circle of radius 2 is equal to its circumference; i.e. 4.pi.

A circle of radius R may be scaled to radius 2 by multiplying the radius by 2/R.  The radius of this circle is then 4pi x (R/2)^2 = pi.R^2.

Finally a “wordless” proof provided by the people at SSSF:

http://www.maa.org/pubs/Calc_articles/ma018.pdf

Posted in Maths, Newton | Tagged , , , , | 4 Comments

Pythagoras, Penrose and Pov-Ray

Images based on Pythagorean tiling, Penrose tiling, and projections onto the Riemann Sphere by PM2ring, a regular contributor to the ABC Self-Service Science Forum (words by the artist):

 Various renderings of a Pythagorean tiling. Mostly using the 3,4,5 triangle. This tiling has been called a “wordless proof” of Pythagoras’ Theorem. It shows by dissection that the area of the “shadow” square on the hypotenuse is equal to the sum of the areas of the squares on the two other sides. IMHO, it’s not quite a wordless proof, since you still have to prove that the large squares are really squares & not just rhombuses.

The floor shows two versions of Penrose tiles, which are intimately related to root(5) and the Golden ratio, so it’s kind of on topic.

Penrose Tiling

A 16 colour checker pattern, displayed on the Riemann Sphere.
Riemann Sphere1

More Riemann Sphere pics. These images look a bit flatter than the first one because they use uniform lighting.

Pythagorean tessellation on the Riemann Sphere.

A checker pattern, with half the squares clear. The other squares are yellow on the outside of the sphere & red on the inside.

The next two pictures use various raytracing techniques to achieve a more photorealistic image.

A pair of spheres in black & white checks, one sitting on its North pole, the other sitting on its South pole.

A pentagonal Penrose tiling.

Posted in Maths, Newton | Tagged , , , , | 3 Comments

Importing text files with VBA – 3

The text import file has been modified to split large files into one or more ranges.

The maximum number of rows for each range is specified, together with a sufficient number of valid range names, which may be on the same sheet or different sheets. The modified file has been tested with a text file with about 1.4 million lines (43 MB). In Excel 2007 this is imported into two ranges in about 10 seconds, or about 75 seconds if it is split into 7 columns. In Excel 2000 the import stopped with a memory error after about 800,000 lines, so for very large files Excel 2007 does seem to have a clear advantage. On the down side, clearing large ranges in Excel 2007 is often excrutiatingly slow. Clearing the 1.4 million lines of data imported in 10 seconds took several minutes!

The ReadText UDF has also been modified to work with large files. It is now possible to specify a column with a list of line numbers, and only the specified lines will be imported. In this way the complete file may be imported into separate ranges, or parts of the file may be conveniently extracted. Note that if the UDF is used with a file exceeding the number of available lines in the spreadsheet the UDF will return an error if the line numbers have not been specified. For smaller files the line number list is optional.

The final refinement in this version is that the SplitText routines now allow the maximum number of columns to be specified. This is illustrated with a directory listing, with the file date and size details split into columns, but the name kept in one column, even if it includes spaces.

Download Text-in2.zip Ver1.30

1.4 million line text file imported into Excel 2007 in two ranges (about 10 seconds)
Read text from large file - output split into 2 ranges

Bottom of range 1 (just to prove it’s all there!)

Read text from large file - XL2007 bottom of range 1

1.4 million line text file split into columns (about 75 seconds)

Read and split text from a large file

ReadText function reading every 40th line from the 1.4 million line text file
ReadText and SplitText functions with specified row numbers

Reading a directory listing into 5 columns

Directory listing - split into 5 columns

Posted in Excel, UDFs | Tagged , , , , , | 20 Comments

Irish Graffiti

On the 16th October 1843 the Irish mathematician William Hamilton was taking a walk with his wife, alongside the Royal Canal in Dublin, when the answer to a problem that he had been puzzling over came to him, and he was so excited by this discovery that he carved the equation:

I2 = j2 = k2 = ijk = -1

on a stone of the nearest bridge.

History does not record the reaction of his wife to this act, but judging by his recollection of his conversation with his sons:

Every morning in the early part of the above-cited month, on my coming down to breakfast, your (then) little brother William Edwin, and yourself, used to ask me: “Well, Papa, can you multiply triplets?” Whereto I was always obliged to reply, with a sad shake of the head: `No, I can only add and subtract them”.

I suspect that she was not unduly surprised.

The graffiti was soon worn away, but the event was later recorded more permenantly with a commemerative stone with the words:

Here as he walked by
on the 16th of October 1843
Sir William Rowan Hamilton
in a flash of genius discovered
the fundamental formula for
quaternion multiplication
i2 = j2 = k2 = ijk = -1
& cut it on a stone of this bridge

For more information look here: http://math.ucr.edu/home/baez/dublin/ for an account of a trip to the bridge by mathematician John Baez and friends, including some nice photographs of the structure itself.

Another site with more on the mathematical significance of the quaternion, and a quote from Hamilton himself: http://adaptivecomplexity.blogspot.com/2007/06/science-in-against-day-vectors-and.html

Posted in Arch structures, Maths, Newton | Tagged , , | Leave a comment