
Following a comment at update-to-glob_to_loc3-and-loc_to_glob3-functions, I have modified the Python code at the linked site, so it can be run from Excel, via xlwings. The spreadsheet described below, and the associated Python code, can be download from:
3DCirc.zip
The original code and background information can be found at: Fitting a Circle to Cluster of 3D Points. The code performs the following functions:
- Generates points along a circular arc, then applies a random 3D offset to these points, to generate a cloud of points close to the original curve.
- Finds the best fit circle passing through these points.
- Generates graphs of the points, and the best fit circles, using Matplotlib.
To simplify the process as far as possible, I have converted the code to two user-defined functions (UDFs) that can be called from Excel, using xlwings, to generate the cloud of points, and to return the coordinates of a series of points along the best fit circle, or along an arc extending over the range of the data. This data is then plotted in Excel, using xy charts.
Typical spreadsheet input and output are shown in the screen shots below:
The Points_by_ang function generates points along an arc of the specified circle, with random 3D offsets of magnitude determined by the k factor. The input data in the example is the same as is hard coded in the original Python code. The Fit_circ3D functions returns 3D coordinates along the best fit arc or circle (or alternatively other results, as defined by the “out” value). Note that if the number of generated points is changed from 100, the range must be adjusted in the fit_Circ3D function, so that all of the input data range contains real numbers, not #N/A# or blank cells.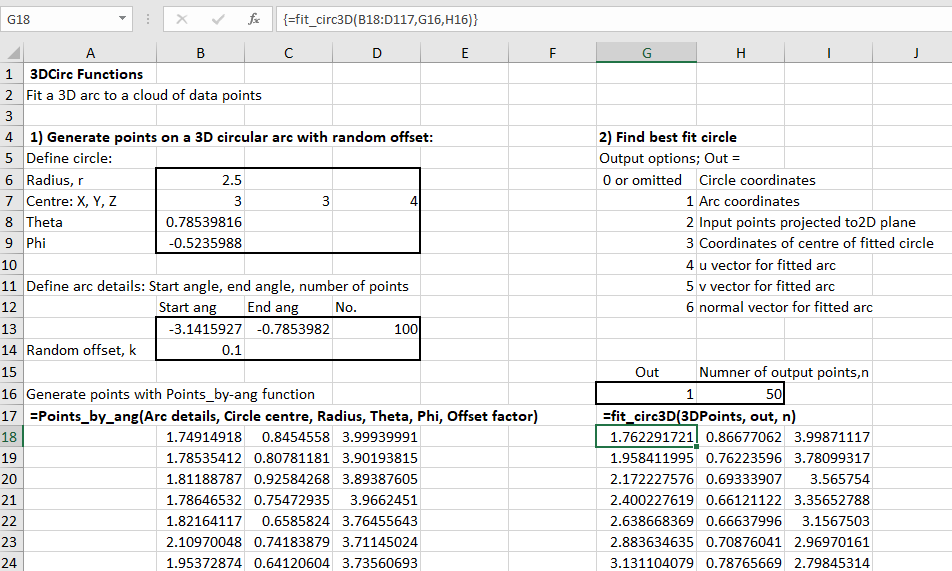
The best fit circles, projected to the XY, XZ and YZ planes, are shown below: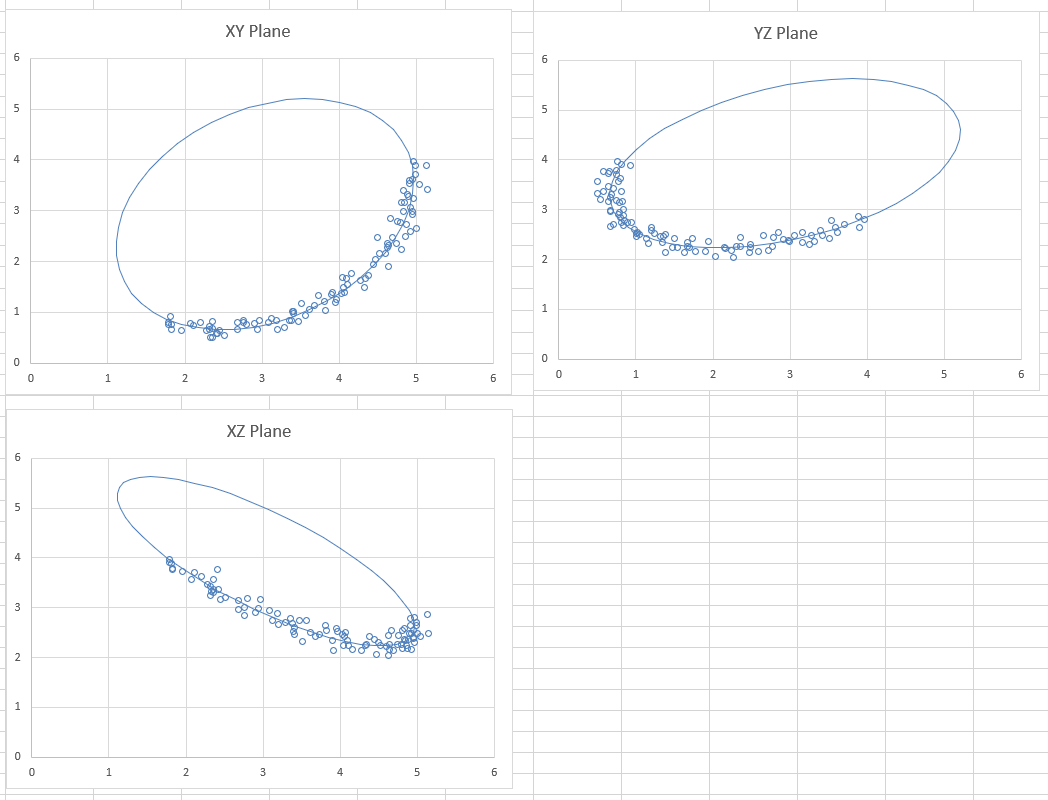
The Matplotlib results from the original code are very similar: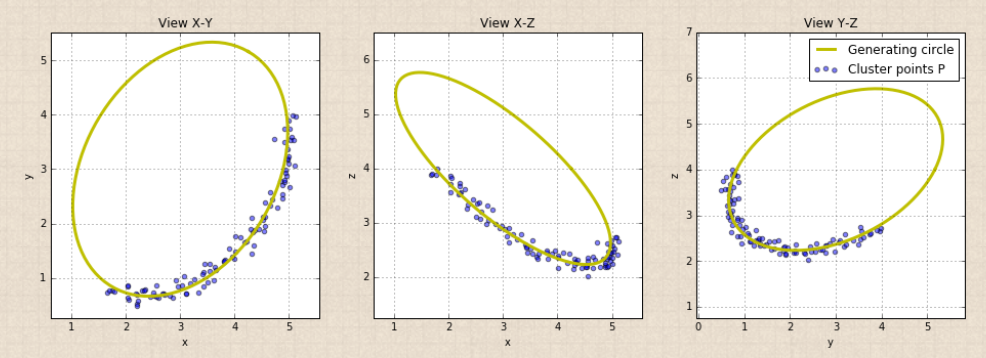
Changing the input data, the graphs automatically re-draw to show the new results: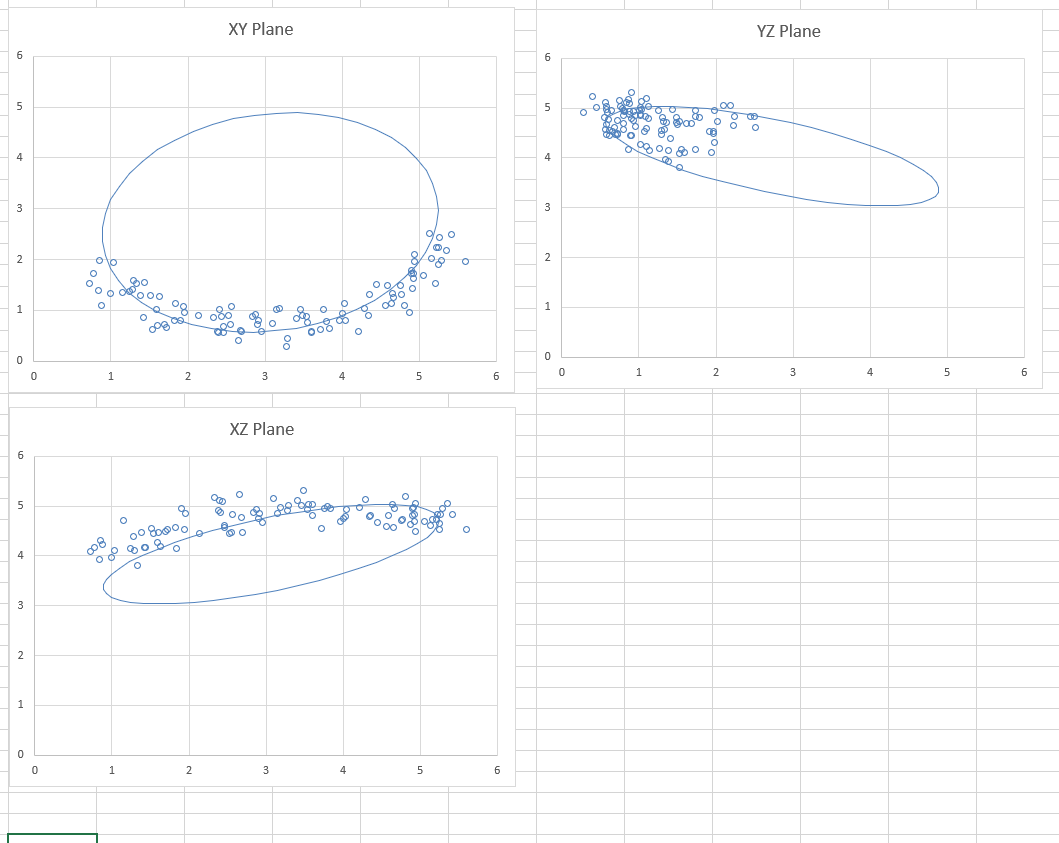
To use different input points (either generated from another source, or real survey data) simply paste the data anywhere in the spreadsheet, and adjust the “3DPoints” range in the Fit_circ3D function, and the chart data ranges for the input data.
To use the spreadsheet:
- If necessary, install Python, Numpy, and xlwings. All the necessary packages are included in the default Anaconda Python installation.
- Copy 3DCirc.xlsm and 3DCirc.py to any convenient directory.
- Run 3DCirc.xlsm, and if necessary enable macros.

Pingback: More Python rotation functions | Newton Excel Bach, not (just) an Excel Blog
Hi, I will like to share my deep appreciation and say thank you for the great work shared on this site.
A few comments/observations to the “fit_Circ3D” function:
1) Least-squares algorithm not always providing expected distinct minimum.
Example: Function applied to a set of 101 XYZ data points along a 10m nearly straight beam. The expected result would be a circle with a large radius of app 6000m. The actual result is a circle with a 44m radius, crossing the line of data points at two locations: …/……..\…
I posted the issue to the author of the original Python script who referred to the following site for a potential solution: http://scipy-cookbook.readthedocs.io/items/Least_Squares_Circle.html. The proposed “leastsq with jacobian” method could be interesting to try.
2) For output option; Out = 3, it would be helpful if the circle radius [mean(Ri)] was provided in addition to coordinates of centre of the fitted circle.
3) Has the output options Out = 0 and Out =1 been interchanged?
If not too much to ask, would it be possible to recompile the “fit_Circ3D” function with the above changes and also providing an example VBA code for running the “fit_Circ3D” function.
LikeLike
Thanks for the comments and the feedback.
I’ll certainly have a look at the suggested changes when I have some time.
LikeLike
Thanks again for the link. I have now created a UDF with six “method” options:
0: The original code
1: Essentially the same, but using the code from the link
2-5: Options 2, 2b, 3 and 3b from the link.
Methods 2-4 are giving better results with short, large radius arcs.
Method 5 is not working properly yet.
If you would like an advance copy, please email dougaj4 at gmail, or I will post on the blog when I have got option 5 to work (or given up on it).
LikeLike
Pingback: More circle fitting options with Scipy | Newton Excel Bach, not (just) an Excel Blog
Hi Dougaj
Certainly being no programmer i am unable to troublshoot your xls file with code.
Ive downloaded the Anaconda package and run the xlm file but to no avail.
Im getting a compile error, “Invalid outside procedure”
What am i doing wrong?
LikeLike
Hi Aaron, Have you installed xlwings, and tried a simple example from their documentation? I have been using pyxll rather than xlwings recently, but if you can get a simple function working let me know.
Any problems with xlwings installation it would be best to raise at the xlwings site.
LikeLike