There are many sites discussing the Mandelbrot Set, but not many examples using VBA to plot the set in Excel, so here is my effort:
The spreadsheet (including open source VBA code) may be downloaded from:
Note that to keep the download file a reasonable size the file has been saved with a low resolution image. 350 x 350 resolution gives a good compromise between image quality and speed of processing and plotting.
Required input is:
- Centre point coordinates
- Plot width (= height)
- Plot resolution
- Number of iterations
The results are plotted as a scatter chart with 7 data ranges, plotting markers only.
The plot below was generated with 28 iterations, and a resolution of 350×350. Calculation time was 0.33 seconds: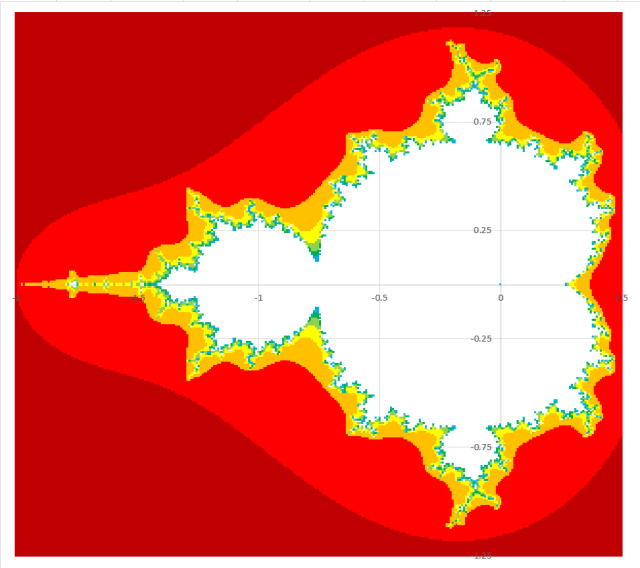
The second example was taken from:
How To Quickly Compute The Mandelbrot Set In Python
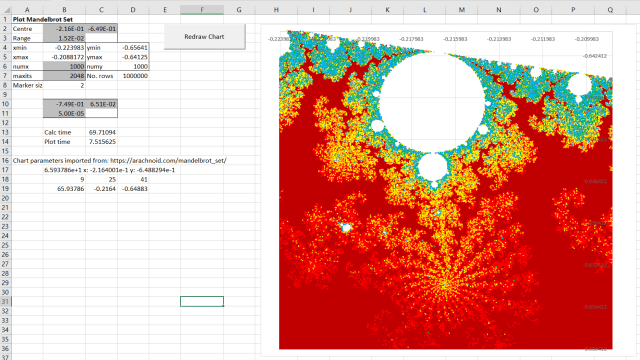
Higher resolution (1000×1000) with 2048 iterations resulted in much longer calculation time, but times are 2-3 times faster than the plain Python code given in the link:
For faster plotting compiled code is required. A good site providing fast high resolution plots for user selected location, scale and number of iterations is:
Mandelbrot Set
The site text says the plots will not work in Microsoft browsers, but they worked with no problem for me in Internet Explorer. The image below was generated in the spreadsheet using parameters from the link above.