xlwSciPy update for Python 3

The xlwSciPy spreadsheet allows a wide variety of the science and maths functions in the Python Numpy and Scipy libraries to be called directly from Excel.  The spreadsheet has now been updated for use with Python 3.  The spreadsheet and all associated Python code can be downloaded from:

xlwSciPy3.zip

The spreadsheet requires installed copies of Python, including Numpy and Scipy, and xlwings.  The easiest way to install the required packages is to install the Anaconda Python library.  When the required Python packages are installed simply copy the contents of the xlwSciPy3.zip file to any convenient folder.

The functions included in the spreadsheet are indexed below:


Posted in Coordinate Geometry, Differential Equations, Excel, Link to Python, Maths, Newton, Numerical integration, NumPy and SciPy, Python Pandas, UDFs, VBA, xlwings | Tagged , , , , , , | 2 Comments

Jørn Utzon and David Moore

Tomorrow (9th April 2018) is the centenary of the birth of Jørn Utzon, the architect of the Sydney Opera House, which is celebrated in an article at the Sydney-Morning Herald.

The article quotes a grand-son of Utson, Mika Utzon Popov, on the role of David Moore in documenting the construction work and the finished structure:

But he does know that his grandfather wanted the world to view the Opera House through the eyes of David Moore, the photographer who documented progress at Bennelong Point in the 14 years it took to build. His grandfather wrote to Moore saying he hoped his photos would be a lasting legacy for the nearly 10,000 construction workers who built it.

“I hope your photos can be seen in Australian magazines because the Sydney Opera House needs to be seen with a great artist’s eye to make people understand its poetic qualities,” he wrote.

See more of the work of David Moore at: 100 photographs portfolio

Posted in Arch structures, Bach, Newton | Tagged , , , | Leave a comment

Two sources of perpetual motion

The buttered cat phenomenon:

The pulling-yourself-up-by-your-boot-straps technique:

Posted in Bach | Tagged , , | Leave a comment

Plotting Charts With Gaps …

“How do you get VB6 to initialize doubles with +infinity, -infinity and NaN”… and various sorts of Not a Number.

Back in 2012 (When is an xy chart not an xy chart) I concluded that it was not possible to return an array with empty rows from a user defined function (UDF), and as a result it was not possible to generate a series with gaps in an x-y chart, using a UDF or an array function.

Recently Lori Miller has provided two solutions to this problem (see comments at the link above).  First the easy way:

For users of Excel 365 there’s now an option to “show #N/A as an empty cell” under hidden and empty cell settings dialog.  Right-click on a chart and select “select data”:

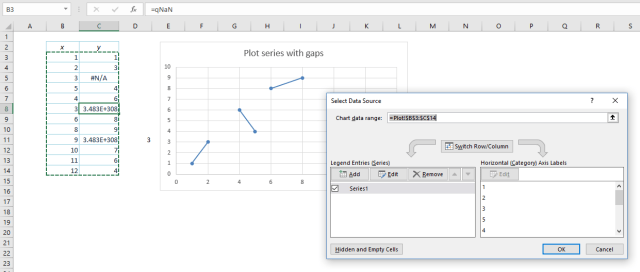
Click “Hidden and Empty Cells” and select “Show #N/A as an empty cell:

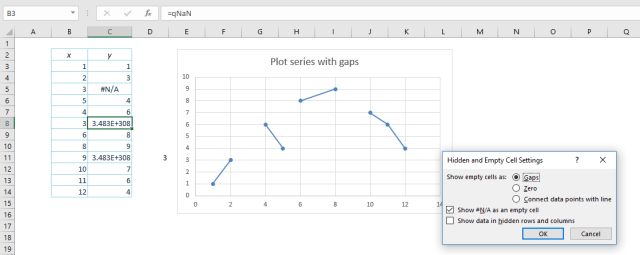
The XY chart will now display a break between the two values either side of the #N/A, and will retain all the features of an XY or scatter chart.

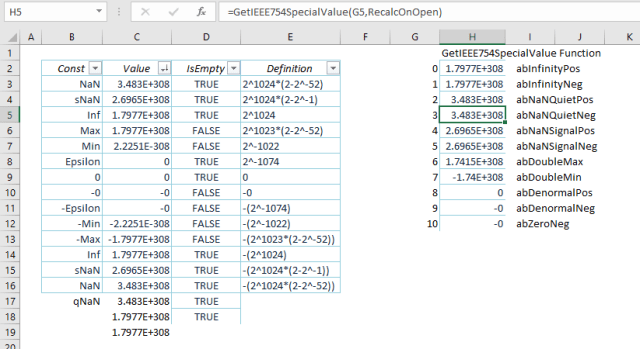
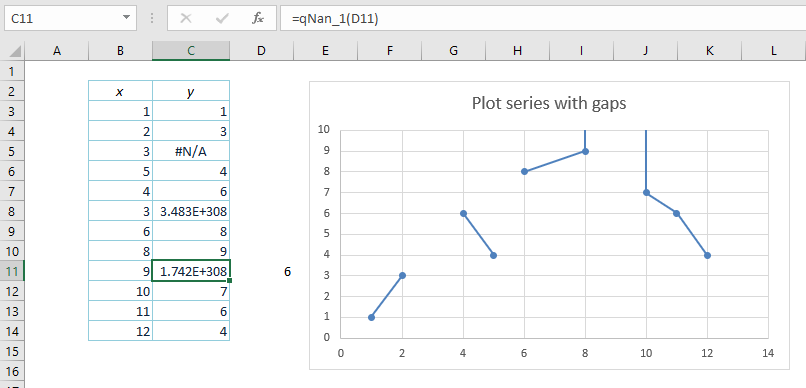
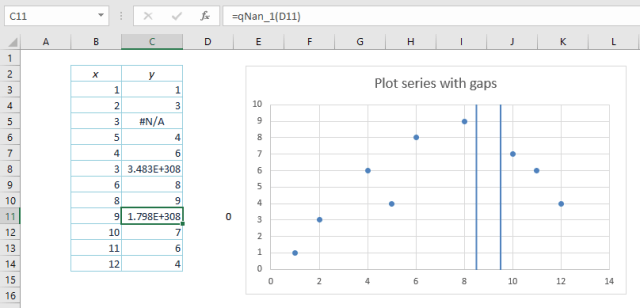
For those not using Office 365 it’s not so easy , but the spreadsheet SpecialNum.xlsb, using code from the Stackoverflow discussion at “How do you get VB6 to initialize doubles with +infinity, -infinity and NaN” (link also provided by Lori Miller) has a solution.  This spreadsheet has a function returning various types of “not a number”, or NaN.  Nan index 3 returns a value that is treated as a blank cell in XY charts (cell C11 below):

This value is the only one that produces the desired result.  Index values 0 to 2 and 4 to 5 turn the chart into two vertical lines either side of the NaN:

Index 6 retains the rest of the chart, but has two vertical lines either side of the gap going up (presumably to infinity):

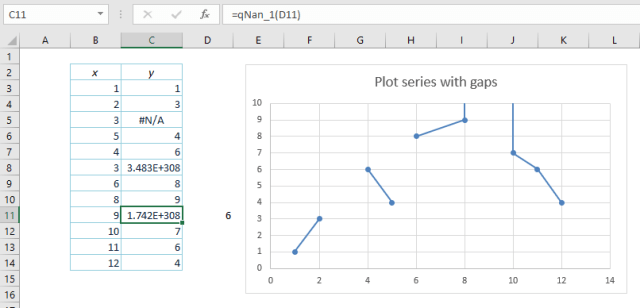
Index 7 is similar, but with the lines going downwards.

Index values 8 to 10 plot as 0:

For those interested in the details, the download file has open-source code for generating the different NaN values, and also a table listing the numbers and their features:

Posted in Arrays, Charts, Charts, Excel, UDFs, VBA | Tagged , , , | 7 Comments

More circle fitting options with Scipy

A comment on the first post on this topic found that the method used did not work well for short arcs of large radius circles.  An example of the problem can be seen in the screen shots below:

The function has returned an arc with a radius of only 85 m (rather than 6000), and the plots below show that the generated arc is a very poor fit to the data:

The comment pointed to the following page at the SciPy CookBook:

Least squares circle

which provides Python code for 5 alternative fitting methods:

  1. Solve linear system with linalg.solve
  2. Basic usage of optimize.leastsq
  3. Advanced usage of optimize.leastsq, with jacobian
  4. Basic usage of orthogonal distance regression (ODR) with an implicit function definition
  5. Advanced usage of ODR, with jacobian

To accommodate these alternatives in the Fit_Circ3D function I have added an optional “method” argument to the function.  Method 0 calls the original routine.  Methods 1-4 call the SciPy methods listed above (default method = 3 if the argument is omitted).  I have not been able to get method 5 to work properly from my code, so at the moment this option is not available.

The results with method 3 of the new code are shown below, showing a good fit to the scattered data, even with a short large radius arc  (click on the image for full-size view):

The code for the new methods (adapted from the original so that it can be called from Excel, via xlwings) can be found in least_squares_circle2.py.  This file, the spreadsheet IP2_py.xlsb, and the associated Python file IP2_py.py are all available for free download from:

IP2_py.zip

In addition to Excel, the following (free) software is required by the spreadsheet:

  • Python
  • Numpy and Scipy
  • xlwings

All are included in the default Anaconda Python installation.


Posted in Coordinate Geometry, Curve fitting, Excel, Link to Python, Maths, Newton, NumPy and SciPy, UDFs, VBA, xlwings | Tagged , , , , , , , | Leave a comment