Canadian Astronaut, Commander Chris Hadfield, reminds us of all the great many positives that happened in 2016. :
Recent Comments

Canadian Astronaut, Commander Chris Hadfield, reminds us of all the great many positives that happened in 2016. :
The load table for the 3D Frame spreadsheet has a column listing the global axis for each load as text (X, Y, or Z). In the VBA version the table is converted to a variant array, and the axes are handled with a Select Case statement. This will not work in Python, because the load data is copied to a Numpy array, which will not handle data of different types. If the data type is not specified then all the data is converted to strings, or if a numeric data type is specified Numpy returns an error.
Converting text to a number based on the ASCII code value can be done easily on the spreadsheet using the CODE() or UNICODE() functions. In this case X, Y, and Z (or x,y,z) are to be converted to 1, 2, or 3 respectively. The ASCII code for W is 87, so the function required is:
In VBA the equivalent function is Asc():
Function TextToNum(Txt As String, Optional Offset As Long = 0)
    TextToNum = Asc(Txt) - Offset
End Function
Doing the conversion in Python (using xlwings to transfer the data from Excel) requires a little more work. The column with the text data must be converted to values before converting the data to a Numpy array, but the Excel range, which is converted to a Variant array in VBA, is transferred to Python as a Tuple, which is an immutable object. A single row of data could be converted to a list with:
DistLoads = list(DistLoads)
But a multi-row range will be passed as a tuple of tuples, which the code above will convert to a list of tuples, leaving the data still in immutable form. The map function will convert all the data to list form:
DistLoads = map(list, DistLoads)
The text in the Axis column (Column 2) can then be converted to integers with:
for row in DistLoads:
        if type(row[1]) == unicode:
            row[1] = ord(row[1].upper())-87
The resulting list of lists can be converted to a Numpy array with:
if type(LoadA) != np.ndarray: LoadA = np.array(LoadA, dtype=np.float64)
Note that:
Browsing links on Brent’s Method I found:
Daft Engineer – Numerical Methods and Excel*
which is well worth a look (plenty of stuff on statistics and Python, with the odd dash of Excel). The link has VBA code for a class based Excel user defined function implementing Brent’s Method to find the roots of non-linear equations. Time permitting, I’ll have a look and compare with my effort
* From a quick survey of the blog, I ‘m not convinced of the daftness of the author, but he should know I suppose.
… is a song by Harry Nilsson, released in 1972:
but somehow, the BBC managed to record three gorillas singing the same song in 1971:
Thereafter, the song was recorded by a wide variety of creatures, including Muppets:
and Dannii Minogue:
In the course of adding provision for spring end releases to the 3DFrame spreadsheet, I have also tidied up the code for generating the structure stiffness matrix, and added some documentation to the spreadsheet. The revised spreadsheet (version 2.02) can be downloaded from:
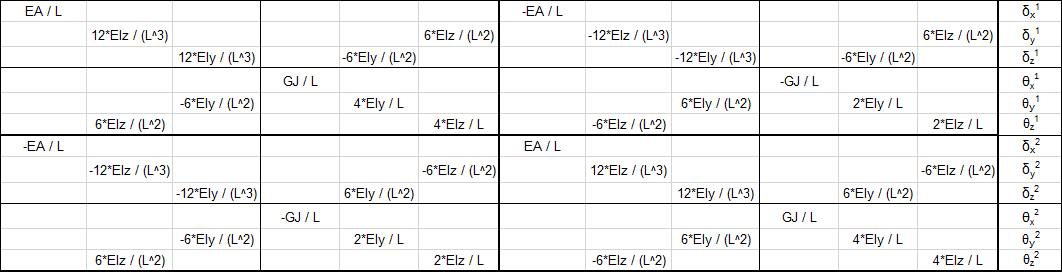
The original version of the spreadsheet, using code from Programming the Finite Element Method, used a beam local axis system with the local x axis aligned with the beam longitudinal axis, the local z axis parallel to the Global ZX plane, and the local y axis completing the right-handed axis system. The beam stiffness matrix consistent with that system is shown below (click the image for a full sized view, or see the “Matrix examples” sheet of the download spreadsheet for a text version):
The Strand7 finite element program uses an alternative system (shown below), and because this program is used to check the results of the spreadsheet I have modified the code to use the same system:
Beam principal axes are defined as i1 to i3, where:
This procedure in effect creates the i2 Axis parallel to the XY plane, and the i1 Axis in the plane parallel to the Z axis; i.e. the Z axis is in effect defined as the vertical axis in the model, and the XY plane is horizontal.
This system is shown in the screen shot below:

In Strand7 the web of I girders is by default aligned with 2 axis, so that the beam flexural stiffness values, I11 and I22, relate to the beam strong and weak axis respectively, as shown below:

The beam local stiffness matrix for this system is shown below:

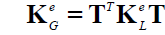
To combine the beam stiffness matrices into a single global matrix they must all be rotated to a common set of axes, that is the Global XYZ system, using:
where T is the 12×12 rotation matrix, made up of 4 copies of the 3×3 matrix below:

where:
The rotation matrix transpose, TT is:

Application of this method to a single beam is shown in the screen shots below (from the Matrix Examples sheet of the download file).
The local stiffness matrix, KM1:

The rotation matrix, T:

The transpose of the rotation matrix, TT

The matrix CC = KM1.T

The global stiffness matrix KM2 = TT.CC

Alternative beam examples can be generated on the Matrix Examples sheet, by entering a different beam number in Cell C18:

Edit 19 Dec 2016: Formula for Den corrected


