Nearest Lookup Function

The Excel Lookup functions (including VLookup, HLookup and Match) all allow for an “exact” or “closest” match on numerical data, but the closest option has a number of problems:

  • The data must be sorted
  • For VLookup and HLookup the data must be sorted in ascending order, but if it isn’t the function may return an incorrect result, rather than #N/A.
  • For Match the data may be sorted in either ascending or descending order, but if the actual order is either unsorted or different to that indicated the function may return an incorrect result.
  • The terminology used for the argument defining the match type is non-intuitive, and inconsistent between the Lookup functions and the Match function.
  • The default option (ascending sort) may produce incorrect results, whereas the option for an exact match will always return either a valid result or #N/A.
  • With ascending sorted data the functions will return the last value less than the lookup value, rather than the closest match.
  • With descending sorted data the Match function (with Match Type = -1) will return the last value greater than the match value, rather than the closest match.
  • The match will only look at data in a single column.  There is no built-in function to return the closest point in 2D, 3D, or higher dimension space.

Some of these problems may be avoided by using the Round function on the lookup value, then doing an “exact” lookup, but this can also return misleading results in some circumstances, and does not handle multi-dimensional data.

To deal with all these problems I have written a Nearest() user defined function (UDF) that works on unsorted numerical data with any number of dimensions, and will return:

  • The coordinates of the nearest matching point
  • The row number of the nearest matching point
  • The distance from the lookup point to the matching point

Optionally a “maximum error” distance may be specified, and the function will return “No match” if there is no point within this distance.

A second UDF, Dist(), returns the distance between any two multi-dimensional points.

The spreadsheet, including full open-source code, may be downloaded from: Nearest.xlsb

The screen shots below illustrate the problems with the Lookup functions, and use of the Nearest UDF.

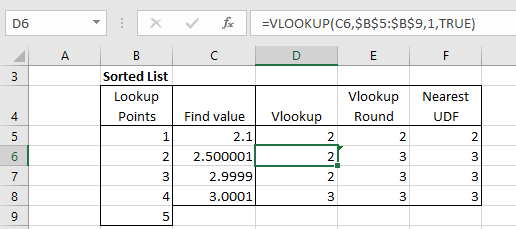
With sorted data and equally spaced data Vlookup returns the highest value less than the lookup value, rather than the nearest match.  Using the Round function on the lookup value in this case returns the correct results:
nearest1-1

If the data values are not equally spaced VLookup on the rounded number no longer returns the correct result:
nearest1-2

With an unsorted list VLookup returns #N/A when the lookup value is less than the first data value, but if it is greater it returns the value before the first data value greater than the lookup value:
nearest1-3

Setting the VLookup “Range_lookup” value to FALSE (i.e. an exact lookup), returns #N/A in all cases in this example, because none of the lookup values have an exact match in the data.  Rounding the lookup value to an integer returns a match in all cases in this example, but not always the closest match.  The Match/Index combination with “Match_type” set to -1 (descending sorted list) returns a value when the lookup vale is less than the first value in the lookup data, but this is not necessarily the closest match.
nearest1-4

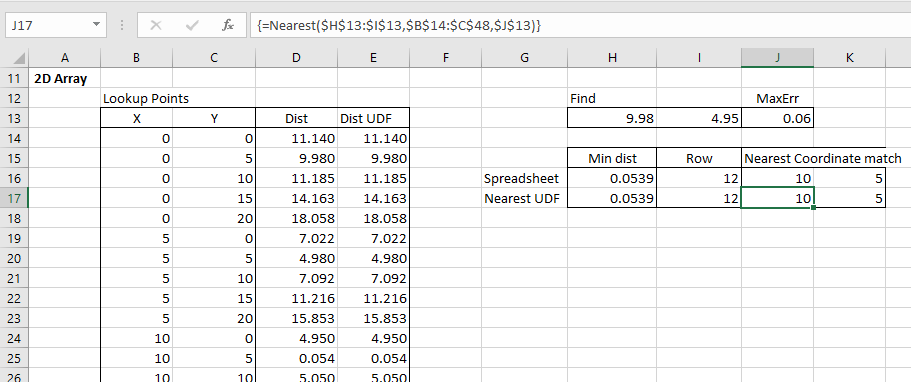
With an array of 2D (or more) coordinates the Nearest UDF returns the coordinates that are closest to the lookup points.  The function will also return the row number of the matching coordinates or the distance from the lookup point to the nearest mach.

The lookup can also be carried out with the Index and Match functions:

  • Generate a list of distances from the lookup point to each of the data points.
  • Find the smallest distance with the Min function
  • Use Match with the exact option (Match_type = 0) to find the row number
  • Use Index to find the coordinates of his point>

Note that using the Nearest UDF all these steps are incorporated in the UDF, and no additional calculation is required:
nearest1-5

The Nearest UDF has a MaxErr option that requires matching data to be within a specified distance of the lookup point. Reducing this value to 0.05 with the example data returns “No match” because the closest data point is 0.054 from the lookup point:
nearest1-6

Posted in Coordinate Geometry, Excel, Maths, UDFs, VBA | Tagged , , , , , , , , | 2 Comments

The Pentangle in Europe

Two recent You Tube uploads of Pentangle performances in Europe.  The first is from Norwegian TV in 1968, singing the Anne Briggs song The Time has Come:

The second from French TV in 1972, with 6 songs, mostly from their Reflection LP:

Posted in Bach | Tagged , , , | Leave a comment

Non-linear frame analysis; moment curvature and self-weight

The Python/Fortran/Excel frame analysis program (previous version here) now has several new features added to the 2D-solver routines:

  • The beam bending behaviour may now be specified with moment-curvature tables, rather than the linear-plastic behaviour required in the previous version.
  • Beam self weight may now be specified with a density for each material, and a gravity factor
  • The analysis may now include non-linear geometric effects, as well as non-linear material properties, with the frame geometry being reconstructed after each iteration.

At the moment these features are only available in the 2D analysis; the 3D analysis works as in the previous version.

The new files may be downloaded from:

NonLin-Frame.zip

An example of the non-linear analysis of a semi-circular arch under asymmetric loading is shown in the screen-shots below:

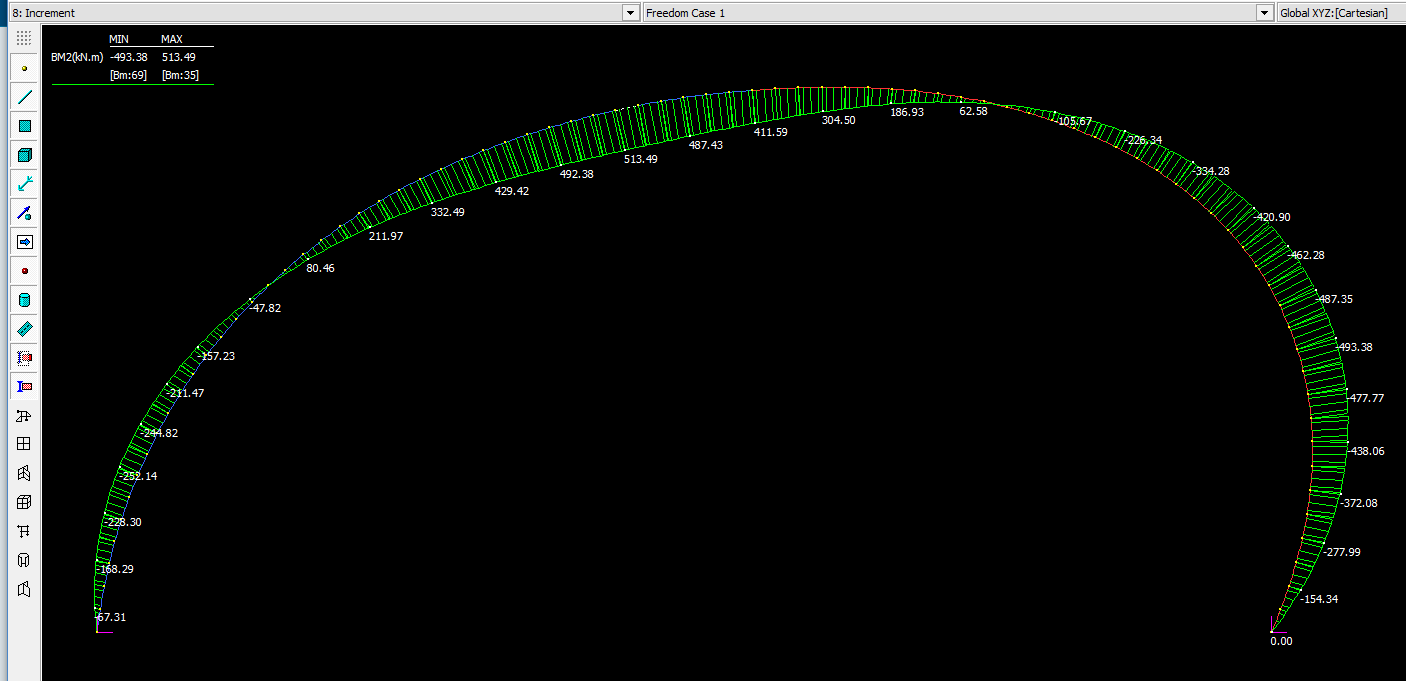
The arch shown below was also analysed in Strand7, using the same moment-curvature tables, and with the non-linear geometry option also selected:
nl-frame3-2a

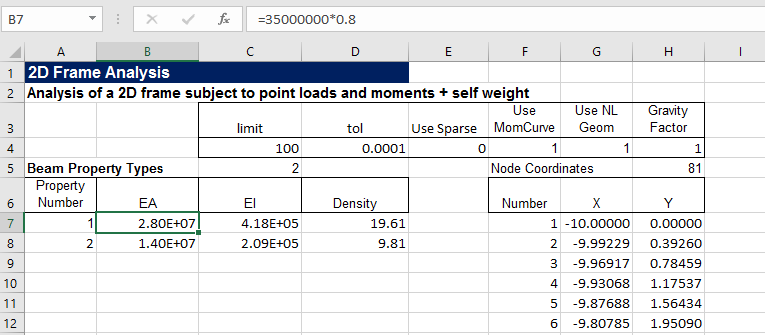
The data input is similar to the previous version, with the addition of “Use MomCurve”, “Use NL Geom” and “Gravity Factor” options, and a column for “density” in the material properties.  The gravity factor should be 1 if density is in force/length units, g if density is specified as mass/length, or zero if self weight is not required.

The table of node loads is still available.  In this version any node loads are applied in the same increments as the self weight.

nl-frame3-1

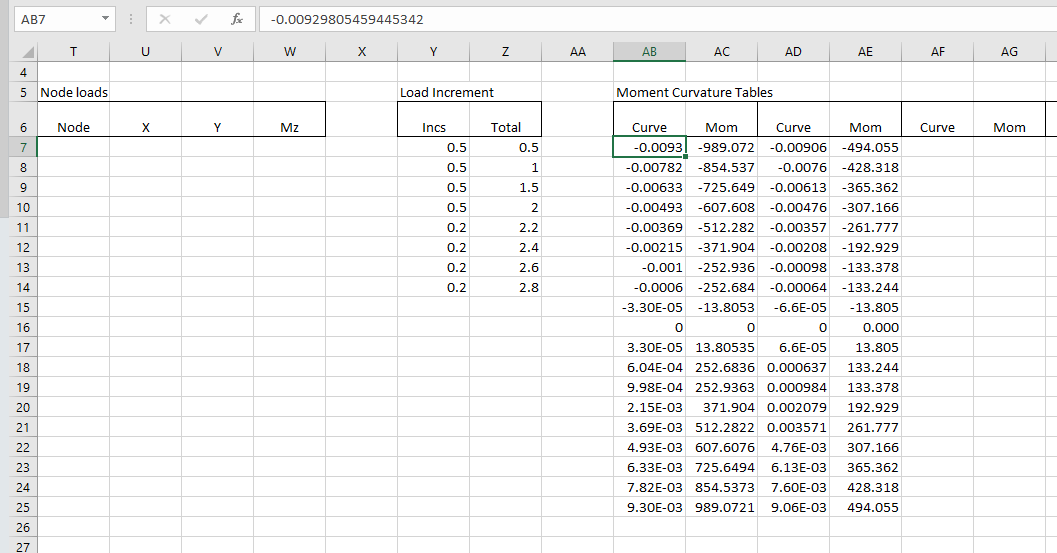
If “Use MonCurve” is activated a moment-curvature table must be entered for each material type.  In the current version the moment-curvature tables are applied in sequence (from left to right) to each material type.
nl-frame3-2

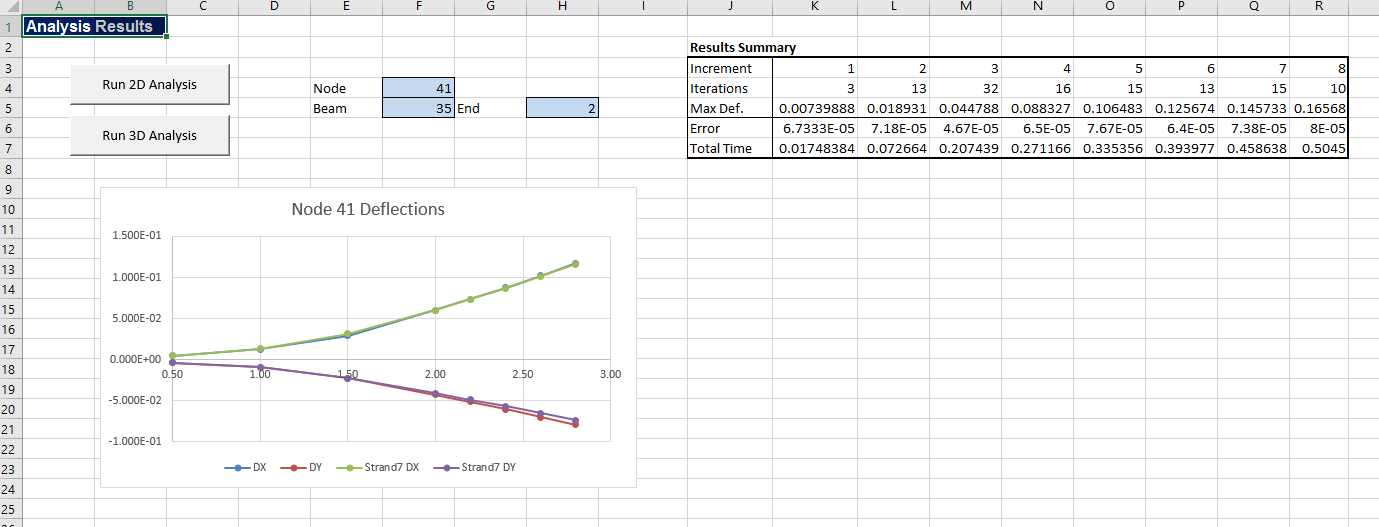
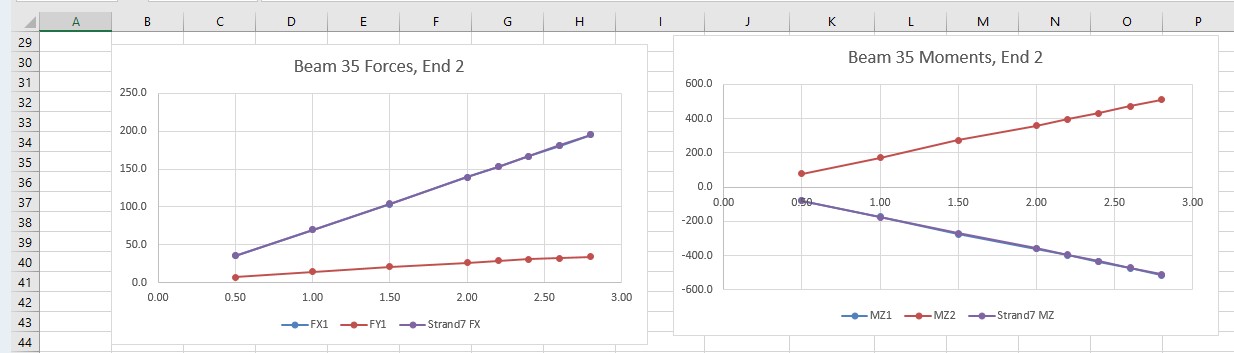
Output is similar to the previous version, with at present rudimentary options for plotting the deflection at a single node, and the forces and moments at a single beam.  The screen shots below also show the Strand7 results for the same structure:
nl-frame3-3
nl-frame3-4

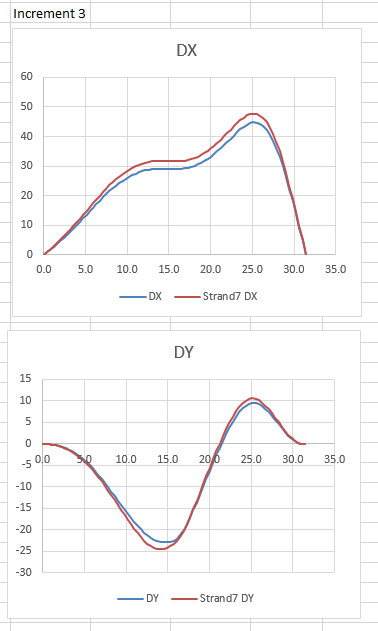
On the “Deflect” sheet graphs have been added to show X and Y deflections for any chosen load increment, showing both spreadsheet and Strand7 results.  Note that at moments just above the concrete cracking moment there are differences between the spreadsheet and Strand7 interpolation methods, resulting in noticeably different deflections:
nl-frame3-5

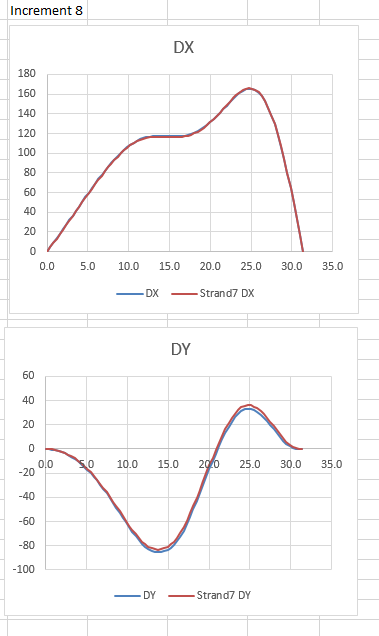
With increased loading however these differences reduce, with deflections under the final loading being very similar:
nl-frame3-6

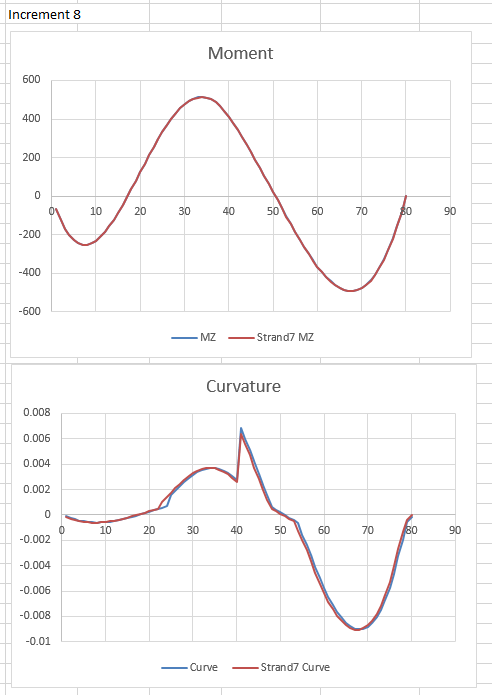
The ForceRes sheet has similar graphs for bending moment around the arch, showing good agreement between the two programs in the final bending moment output.  The curvature results again show small differences in interpolation, especially at the transition from cracked to uncracked behaviour:
nl-frame3-7

Posted in Arch structures, Beam Bending, Concrete, Excel, Finite Element Analysis, Fortran, Frame Analysis, Link to dll, Link to Python, NumPy and SciPy, Strand7, VBA | Tagged , , , , , , , , , , , , , | 1 Comment

Fergus Laing (and a rolling stone)

A song by Richard Thompson.

Any resemblance to any living person is, I’m sure, entirely coincidental.

Fergus Laing is a beast of a man
He stitches up and fleeces
He wants to manicure the world
And sell it off in pieces
He likes to build his towers high
He blocks the sun out from the sky
In the penthouse the champagne’s dry
And slightly gassy

Fergus Laing, he works so hard
As busy as a bee is
Fergus Laing has 17 friends
All as dull as he is
His 17 friends have 17 wives
All the perfect shape and size
They wag their tails and bat their eyes
Just like Lassie

Fergus he builds and builds
Yet small is his erection
Fergus has a fine head of hair
When the wind’s in the right direction

Fergus Laing and his 17 friends

They live inside a bubble
There they withdraw and shut the door
At any sign of trouble
Should the peasants wail and vent
And ask him where the money went
He’ll simply say, it’s all been spent
On being classy

Fergus’ buildings reach the sky
Until you cannot see ‘um
He thinks the old stuff he pulls down
Belongs in a museum
His fits are famous on the scene
The shortest fuse, so cruel, so mean
But don’t call him a drama queen
Like Shirley Bassey

Fergus Laing he flaunts the law
But one day he’ll be wired
And as they drag him off to jail
We’ll all shout, “You’re fired!”

And for something completely different, Richard Thompson is sometimes called England’s Bob Dylan, so here is Scotland’s Bob Dylan, Robin Williamson plays “Like a Rolling Stone”:

Posted in Bach | Tagged , , | Leave a comment

xlwSciPy 1.09 – update for xlwings 0.10 and Scipy 0.18.1

The xlwSciPy spreadsheet (last presented here) has been updated for the latest version of xlwings and Scipy.

The new spreadsheet can be downloaded from:

xlScipy-xlw.zip

including full open source code.

The spreadsheet requires Python, including xlwings, Numpy, Scipy and Pandas (all of which are free, and included in the Anaconda package).

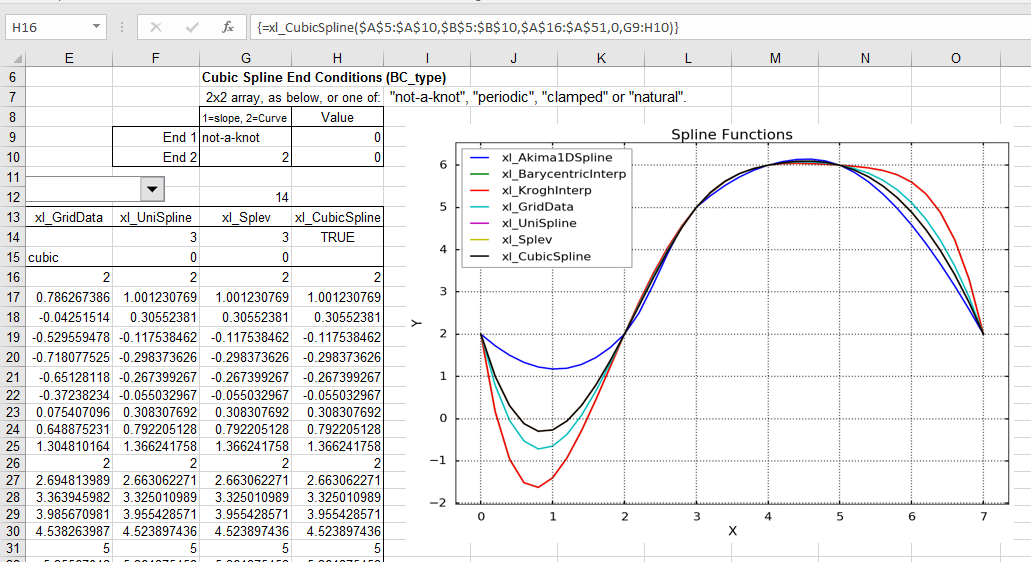
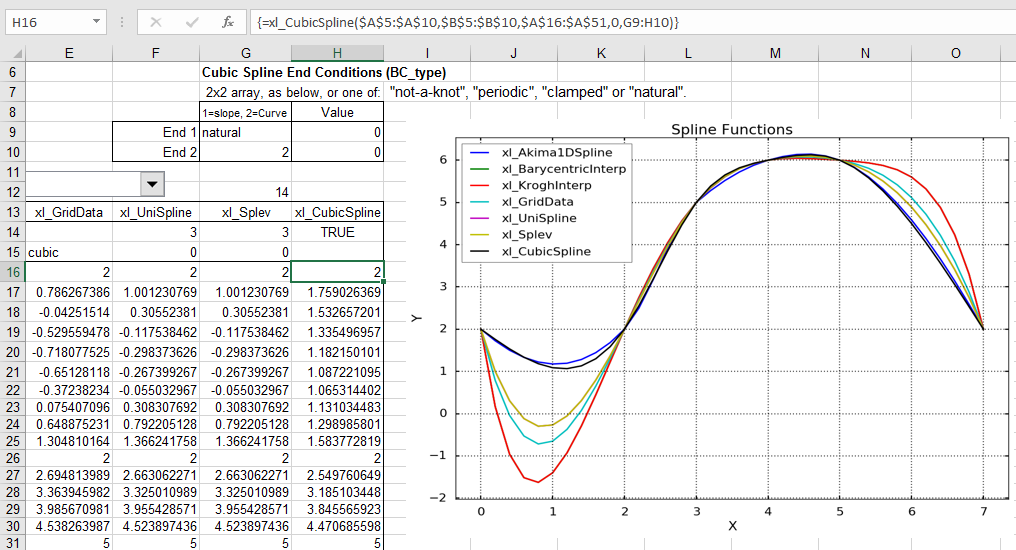
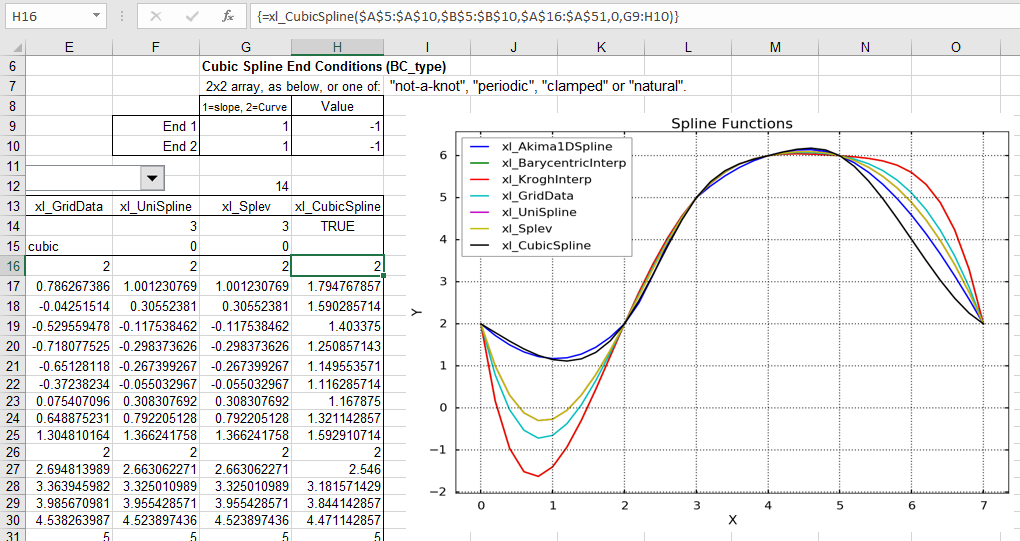
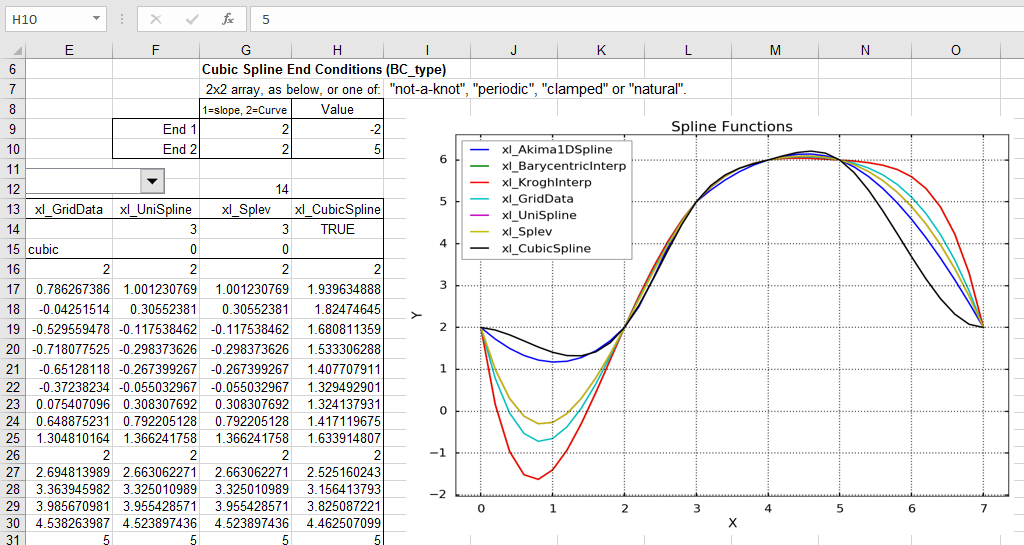
The new spreadsheet includes a CubicSpline function, which is new in Scipy 0.18.  Some options for the new function are shown in the screen shots below:

The function has an optional “BC-type” argument, that controls the spline end conditions.  The argument may be entered as a single text string (one of: “not-a-knot”, “periodic”, “clamped”, or “natural”), or a 2×2 array.  The default value is “not-a-knot”, which returns the same results as the xl_UniSpline and xl_Splev functions:scipy4-1

For the “periodic” option the first and last Y value in the spline data must be equal. The function then returns a curve with equal slope and curvature at each end:scipy4-2

“Clamped” end conditions result in zero slope at the ends:scipy4-3

“Natural” end conditions have zero curvature at the ends:scipy4-4

Using the array argument the slope or curvature may be set separately at each end. The input shown below specifies a slope (1 in column 1) of -1 at both ends:scipy4-5

Similarly the curvature may be set to any desired value with a 2 in column 1 of the BC_type array:scipy4-6

See more detailed documentation at the Scipy Docs.

Xlwings 0.10 introduces a new feature that expands array return values in user defined functions (UDFs) to show all the results, without entering as an array function:scipy4-7

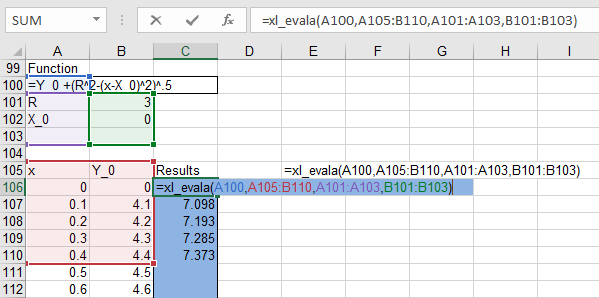
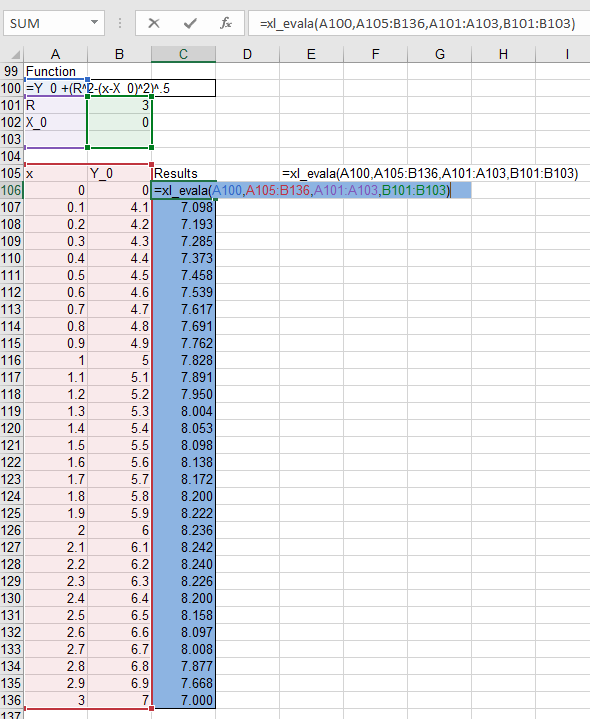
This feature is currently only used in the xl_evala function, on the Eval sheet. Xl_evala returns an array with the same number of rows as the rows with numeric data in the input data.  When entered with the data from row 106 to 110 in the screen shot above, results are  automatically returned to the same rows when the functioned is entered (just press enter, not ctrl-shift enter).

If the input range is extended down to row 136, the output is adjusted to suit: scipy4-8

The Python code required is quite short:

@xw.func
@xw.arg("x", ndim=2)
@xw.ret(expand='table')
def rtnarray2(x):
    return x

This can then be called from VBA …:

Function rtnarray2(x)
        If TypeOf Application.Caller Is Range Then On Error GoTo failed
        rtnarray2 = Py.CallUDF("xlwScipy", "rtnarray2", Array(x), ThisWorkbook, Application.Caller)
        Exit Function
failed:
        rtnarray2 = Err.Description
End Function

… and tacked on the end of any other VBA function:

Function xl_EvalA(func As String, xRange As Variant, Optional SymRange As Variant, Optional ValRange As Variant, Optional ReturnType As Long = 1) As Variant
    ...
    Set result = Py.Call(Methods, "xl_Evalx", Py.Tuple(func, xRange, VarName, SymRange, ValRange))
    Set Result_List = Py.Call(result, "tolist")
    Rtn = Py.Var(Result_List)

    Rtn = TransposeA(Rtn)
    xl_EvalA = rtnarray2(Rtn)
    Exit Function


Posted in Arrays, Curve fitting, Excel, Link to Python, Maths, NumPy and SciPy, Python Pandas, UDFs, VBA | Tagged , , , , , , , , | 2 Comments