Dealing with dates -1, date values and formats

Following a discussion at Eng-Tips, I have been having a closer look at how Excel handles the entry and display of dates.  The Eng-Tips discussion concerned changes to data when csv files are opened in Excel.  I will deal with that (together with a way to open and save csv files in Excel without changing anything) in a later posts, but for today I want to look at the basics of how Excel stores and formats dates.

Excel stores dates as a day number, starting from 1st January 1900.  If you enter a sequence of numbers: 1, 2, 3, … in different cells, then format the cells as dates, it will display as below:

Dates-1-2

Note that day 60 displays as 29th Feb 1900, which does not actually exist, since century years not divisible by 400 are not leap years.  The extra day was introduced to maintain compatibility with the earlier spreadsheet Lotus 123, who had probably done it by mistake.

There is also an option (under Options-Advanced-When Calculating This Workbook) to set day 1 to 1st January 1904, which is the standard for Apple Mac versions of Excel.  Everything that follows uses the Windows default.

In addition to the Apple/Windows differences the date formats must also cope with different conventions for writing dates, especially when the month is shown as a number, and must deal with text that may or may not be a date.

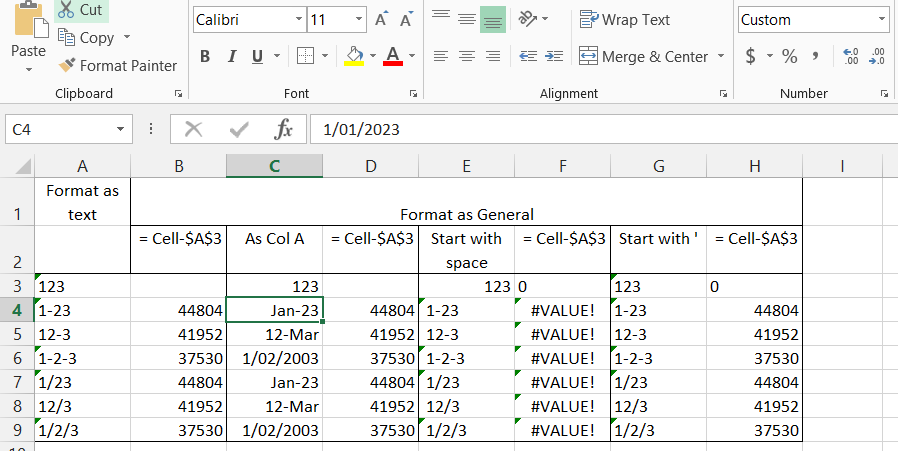
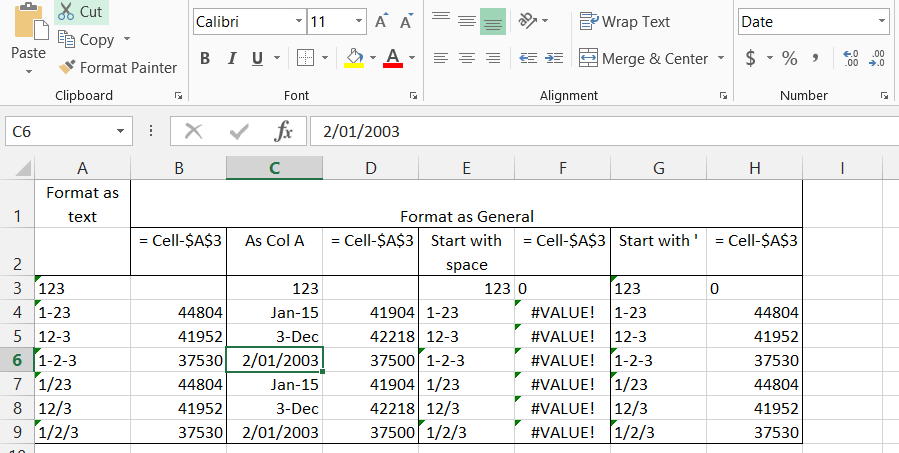
The screenshot below illustrates different behaviour depending on format settings, and the first character of the entered text.  Column A was pre-formatted to “Text” (to display the values as entered).  The remaining columns were left in the default format (“General”).

In Columns A and C the text was entered as shown in Column A.  In Columns D and G the same text was entered, except preceded by a space for Column D and an ‘ for Column G.

Columns B, D, F, and H contain a formula subtracting the value in Cell A3 (123) from the value in the adjacent cell.

The default Windows date display for my location (Australian English) was used, i.e. day-month-year.
Dates-1-1

Note that:

  • The values with a non-numeric character (all except Row 3) are displayed as text in Column A, as entered, but are stored by Excel as a date value, as can be seen in Column B.
  • The  values separated by “-” and “/” are treated in exactly the same way in all cases.
  • The values in Rows 4 and 5 (and 7 and 8) are ambiguous.  In Row 4, 23 is treated as being a year (2023), because it cannot be a month, but in Row 5 the 12 is treated as a day, and the 3 as a month (March).
  • Three separated values are treated as day, month, year, in accordance with the Windows language setting.
  • In Column C the entered text is automatically re-formatted to a date format, but the format depends on the text entered.  Note that 1-23 has been converted to 1-Jan-2023, maintaining the day-month-year format, but 12-3 is converted to 12-Mar-2015, i.e. day-month for the current year.
  • In Column E, where the first character entered is a space,  123 is converted to a number, but all the other entries remain as text, and hence return the #VALUE! error if used in a formula.
  • In Column G, where the first character entered is an apostrophe, all the entries display as text (without the ‘), but as for Column A, they are stored as a date value.

The screenshot below shows details of the format automatically applied to the dates in Column C entered as day-month-year.  This is the standard short date format, and the * indicates that the displayed date will be re-formatted, depending on the language setting.

Dates-1-3

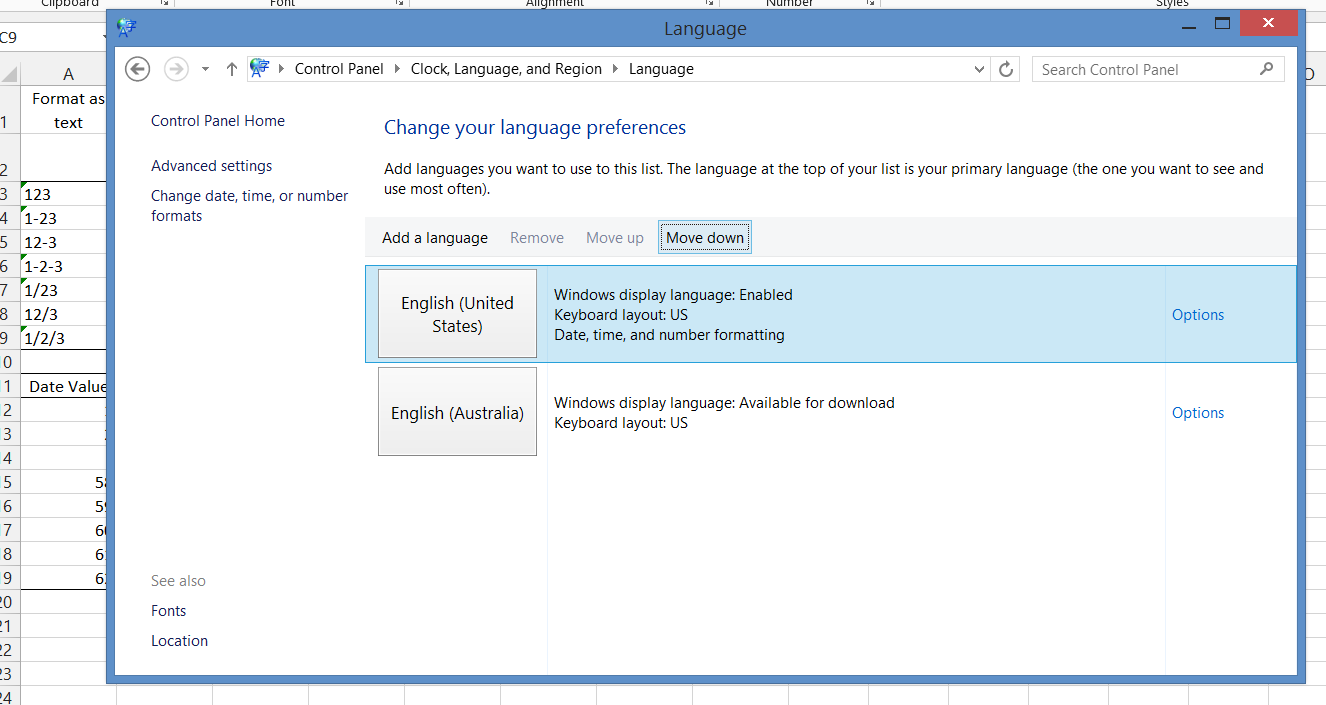
The note above says that the starred date formats will change in response to regional date and time settings, but the default setting (at least in Windows 8) is that the regional date and time settings are tied to the selected language, so to change the date display the Windows language should be changed, as shown below.
Dates-1-4

To change to United States English in Windows 8.1 I had first to add US English to the list in the Control Panel – Language dialog, then move it into top position:
Dates-1-5

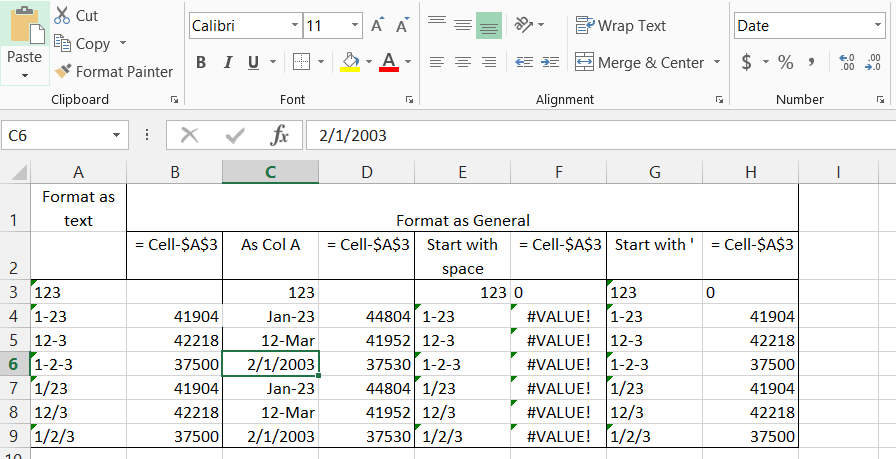
After changing to US English the display is immediately updated:

  • The date values in Column D all remain unchanged.
  • The date display in Column C rows 6 and 9 changes to the month-day-year format.
  • The other dates in Column C are unchanged.
  • The text displayed in Columns A and G is unchanged in all cases, but all the date values have changed.
  • The text displayed in Column E is also unchanged, but in this case there is no corresponding date value.

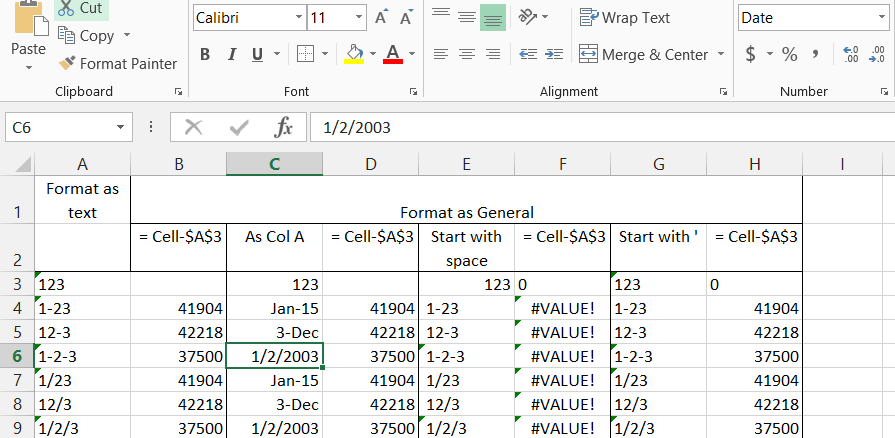
After changing the language re-entering the same values in Column C will result in a new date value:
Dates-1-6

Note that the date values in Column D now match those in Columns B and H.  The dates in Rows 4 and 7 are all the same, but in Columns A and G it is displayed as month-day (i.e. Jan-23rd), whereas in Column C it is displayed as month-year (i.e. Jan-2015).

Returning Australian English to top position in the Control Panel table reverses the process, with the dates in Column C maintaining their date value, but changing format in rows 6 and 9, and text in Columns A and G remaining unchanged, but all the associated date values change:
Dates-1-7

In summary, when everyone using a worksheet with dates uses the same language settings, and the same date format, the automatic formatting features of Excel should present no problem, although it is still necessary to take care when entering dates in day-month (or month-day) format that the correct year is entered.

For situations where worksheets may be shared between countries with different formats however great care should be taken, especially when calculations involving date differences are involved.  Further recommendations can be found in an excellent article at Excel Semi-Pro Regional Date Formats in Excel.

Posted in Excel | Tagged , , , , , | 4 Comments

Reversing Bob

Following our look at Weird Al Jankovic’s palindromic song, Bob, I have written two short VBA User Defined Functions (UDFs) to help writing palindromes (and possibly with other tasks as well).

Reverse() will, as the name suggests, reverse any text entered as the argument, for instance:
” I, man, am regal – a German am I” becomes:
” I ma namreG a – lager ma ,nam ,I”

Reverse also has two optional arguments to start and stop at specified characters, counting from the start and end of the original string, so:
=reverse(“abcdefgh”,2,3) returns:
“fedcb”

Palin() returns a palindrome consisting of the argument string followed by the string reversed, so:
=Palin(“Never od”) returns:
“Never oddo reveN”

Palin has two optional arguments:
“Rev” = False (default) will start with the input string, followed by the reversed string, whereas Rev = True will put the reversed string first.
“RepeatCen” = False (default) will not repeat the last character of the input string, whereas True will repeat the character.

The code for these two functions is quite short:

Function Reverse(Base As String, Optional FirstChar As Long = 1, Optional LastChar As Long = 1) As String
Dim Rtn As String, i As Long

For i = Len(Base) - LastChar + 1 To FirstChar Step -1
    Rtn = Rtn & Mid(Base, i, 1)
Next i
Reverse = Rtn

End Function

Function Palin(Base As String, Optional Rev As Boolean = False, Optional RepeatCen As Boolean = False) As String
Dim Rtn As String, i As Long, LastChar As Long

If RepeatCen = True Then LastChar = 1 Else LastChar = 2

If Rev = True Then
    Rtn = Reverse(Base, LastChar, 1)
    Palin = Rtn & Base
Else
    Rtn = Reverse(Base, 1, LastChar)
    Palin = Base & Rtn
End If

End Function

But since one of the functions is named Palin, we really should do it in Python, which is even shorter:

def palin(pstring, rev, repeatcen):

    lastchar = 1
    if repeatcen == True: lastchar = 0
    strlen = len(pstring)
    if rev == True:
        return pstring[::-1] + pstring[lastchar:strlen]
    else:
        return pstring + pstring[strlen-1-lastchar::-1] 

def reverse(pstring, firstchar, lastchar):
    strlen = len(pstring)
    if firstchar > 1:
        return pstring[strlen-(lastchar):firstchar-2:-1]
    else:
        return pstring[strlen-(lastchar)::-1]

Both versions of the functions can be downloaded from Palin.zip.

The Python version includes all the necessary ExcelPython files, but will need an installed copy of Python.

The files also include the full lyrics of Bob, both forwards and backwards:

Palin1

Posted in Excel, Link to Python, UDFs, VBA | Tagged , , , , , | Leave a comment

Two exceptional musicians

On Saturday night we were treated to fine performances from two exceptional young musicians.  The first was Stefan Jackiw, performing with The Australian Chamber Orchestra at Angel Place.  Here he is playing a Beethoven piece in 2009:

Then after the concert, walking down a traffic free and pedestrian packed George Street, on the way to see the Circular Quay illuminations the guitarist Tom Ward was busking to a large crowd.  Most of the Youtube clips of his outside performances have terrible sound quality, but it’s not too bad on this one:

(the battered guitar is still going!)

It seems that Tom Ward has not yet been deemed Wiki-worthy, but you can read more about him at last.fm.

He also plays inside sometimes:


Posted in Bach | Tagged , , , | Leave a comment

Baby Names and Pivot Tables

boyslast (1)

Baby Boom: An Excel Tutorial on Analyzing Large Data Sets is a comprehensive (and free) tutorial looking at analysing public databases of baby names, using Excel:

There are professional data analysts out there who tackle “big data” with complex software, but it’s possible to do a surprising amount of analysis with Microsoft Excel. In this case, we’re using baby names from California based on the United States Social Security Baby Names Database. In this tutorial, you’ll not only learn how to manipulate big data in Excel, you’ll learn some critical thinking skills to uncover some of the flaws within databases. As you’ll see, the Social Security database, which goes back to 1880, has some weird and wonderful anomalies that we’ll discuss.

The tutorial is comprehensive and well presented, including the following topics:

Download the data andimport it into Excel 
Use Filters 
SanityChecks 
Summarize withPivot Tables 
Add aPivotChart 
AnotherSanity Check 
Explore yourdata and uncover insights 
Determineimportant ratios 
Graph individualdata points and trends 
Visualizeyour data

For more on analysing and visualising data also see the authors blog:
prooffreader.com

About the author: David Taylor is a scientist who does freelance data analysis for paying customers so that he can afford to do fun data analysis for free on his blog, prooffreader.com. (Yes, “prooffreader” is misspelled; that’s the joke!)


Posted in Charts, Excel | Tagged , , , , , | Leave a comment

Managing Data Using Excel …

… is a new book by Mark Gardener, published by Pelagic Publishing.*

It is subtitled “Organising, summarising and visualising scientific data”.  The publishers say of the book:

Microsoft Excel is a powerful tool that can transform the way you use data. This book explains in comprehensive and user-friendly detail how to manage, make sense of, explore and share data, giving scientists at all levels the skills they need to maximize the usefulness of their data.

Readers will learn how to use Excel to:
* Build a dataset – how to handle variables and notes, rearrangements and edits to data.
* Check datasets – dealing with typographic errors, data validation and numerical errors.
* Make sense of data – including datasets for regression and correlation; summarizing data with averages and variability; and visualizing data with graphs, pivot charts and sparklines.
* Explore regression data – finding, highlighting and visualizing correlations.
* Explore time-related data – using pivot tables, sparklines and line plots.
* Explore association data – creating and visualizing contingency tables.
* Explore differences – pivot tables and data visualizations including box-whisker plots.
* Share data – methods for exporting and sharing your datasets, summaries and graphs.

Alongside the text, Have a Go exercises, Tips and Notes give readers practical experience and highlight important points, and helpful self-assessment exercises and summary tables can be found at the end of each chapter. Supplementary material can also be downloaded on the companion website.

Managing Data Using Excel is an essential book for all scientists and students who use data and are seeking to manage data more effectively. It is aimed at scientists at all levels but it is especially useful for university-level research, from undergraduates to postdoctoral researchers.

Clearly the book is aimed at scientists, particularly those dealing with the analysis of observational data, but is it of value to a wider audience?  Having worked through the book I would say that it is definitely worthwhile for many other groups, including those in engineering and other branches of science and technology, and also those in commercial and marketing work dealing with the analysis of numerical data of any kind.

Aspects of the book that I found particularly useful were:

  • Detailed and clear descriptions of the use of pivot tables in the analysis and summary of numerical data of any kind (an area where I could certainly make more use of the features available in Excel)
  • Clearly laid out procedures for arranging, checking and exploring data.
  • Detailed procedures for display of data in a wide variety of graphs.
  • Detailed step-by step example spreadsheets available from the publisher’s web-site.

This is certainly not a book “for dummies”, and some may find the emphasis on scientific procedures off-putting, but for those willing to spend some time working through the examples I believe it will be of value to anyone who uses Excel to organise, summarise and visualise numerical data of any kind.

* Pelagic Publishing provided me with a free copy of the book for this review; I have no other connection with the publishers or the author.


Posted in Charts, Excel, Newton | Tagged , , | Leave a comment