Scipy Statistics Functions – coding and getting help

The Python Scipy library currently has 84 statistics functions.  I have now updated the xlwSciPy3 spreadsheet to access all of them directly from Excel.  The new version can be downloaded from:

xlwSciPy3.zip

As usual, the download includes full open-source code.  As well as Excel, the spreadsheet requires Python, Scipy, Numpy and xlwings to be installed.  The Anaconda Python installation includes all the required files.

The Scipy statistics functions  have a variable number of required and optional arguments.  To allow all the functions to be called from a single interface function the following procedure is used:

  1. Both required and optional arguments are passed to VBA using the ParamArray argument, which will accept any number of separate arguments.  Optional arguments are passed as a pair of separate arguments; the name followed by the value, which may be a single cell or a range.
  2. The VBA xl_Stats function reads the number of required arguments, and converts the required number to a single variant array.  The remaining pairs of arguments are converted to another variant array, and the two arrays are passed, together with the function name, to Python, via the VBA function “xl_callfuncSt0”.
  3. In Python the optional argument array is converted to a dictionary, and together with the required argument array passed to the required stats function.

For the functions to work correctly from Excel it is essential that all the required arguments are provided, and that any optional arguments are passed as a name/value pair.  To help identifying the correct input two VBA functions provide help:

The Get_Args function lists all argument names, together with default values for optional arguments:

These arguments can then be used in the xl_Stats function.  The examples below call the binned_statistic function, using the function name in cell K11.  The first  example passes only the two required arguments: x (K19:O19) and values(K20:O20).  In the second the optional “bins” argument is set to 2, and in the third both optional arguments are provided:

The full help documentation can be called from Excel using the Get_Doc function, as shown below.  The output range for this function can be re-sized by selecting the top-left corner (cell U7) and  pressing Ctrl-Alt-S:

Finally all 84 statistics functions are listed on the spreadsheet, with a brief description of the function output:

The xlw_SciPy3 spreadsheet also links to a wide range of other Scipy functions, as listed at: xlwSciPy update for Python 3.


Posted in Excel, Link to Python, Maths, Newton, NumPy and SciPy, UDFs, VBA, xlwings | Tagged , , , , , , , | Leave a comment

Using Hyperlinks

Hyperlinks are useful to link to other locations in a spreadsheet, or any location with an accessible address, but they can do more than that.

A recent post at Daily Dose of Excel looks at using hyperlinks as a general purpose user interface elements.  As always, both the article and the comments are full of useful content.  Well worth a look.

Posted in Excel | Tagged , , | Leave a comment

On Rythym

“Foli” is the word used for rhythm by the Malinke tribe in West Africa. But Foli is not only found in Malinke music, but in all parts of their daily lives. Directed by Thomas Roebers, this short film portrays the people of Baro, a small town in eastern-central Guinea, and gives you a glimpse inside their culture of rhythm. As the Malinke man says, “Tous les choses, c’est du rythme.” (“Everything is rhythm.”) What makes this film even more beautiful is the fact that it was edited so as to reflect Malinke rhythms.

From Open Culture.

Posted in Bach | Tagged , , , | Leave a comment

Some multi-cultural songs

The latest concert of the excellent Willoughby Symphony Choir featured a collection of popular and folk songs, rather than their usual classical performances.  I was struck by the mixture of cultural influences in many of the songs, and have collected  a few of  my favourite performances with multi-cultural connections.

The first is a song usually associated with the African-American Roberta Flack, but written (I recently discovered) by the English folk singer, of Scottish ancestry, Ewan McColl.  Here it is performed by the Irish folk musician Christy Moore, performed in Scotland:

The next is an English song of life at sea, “A Sailor’s Life”, performed by Sheila Chandra with a unique mixture of Indian and English musical influences:

Next up, the Arabic song “El Helwa Di”, sung by American Anais Mitchell:

Finally, the last performance from today’s concert was the Scottish Song “Blooming Heather”, jointly performed by choir and audience. Here is a performance from Yorkshire lass Kate Rushby, assisted by a (rather larger) audience at the 2007 Cambridge Folk festival:

Posted in Bach | Tagged , , , , , | Leave a comment

Using Section Properties- Group

Following a recent comment I have updated the documentation for finding the section properties of groups of shapes in the Section-Properties-Group spreadsheet.  The revised file can be downloaded from:

Section Properties07-Group.zip

The screenshots below illustrate use of the Group function to find the composite section properties for a circular concrete section with steel reinforcement, taking account of the relative stiffness of the two materials.

First define the concrete shape on the DefShapes sheet:

Note that X and Y axes are tangential to the circle.  To simplify the generation of the reinforcement we want the circle centre at the origin, so in the groups table on the same sheet enter an offset of -R (450mm) for X and Y.  Enter 1 for the elastic modulus, then click the “Create new group” button:

The area should now be the same as in the section property results, but the centroid is moved to the origin, and the associated properties about the X and Y axes will be different.

The reinforcement diameter should now be defined in the section properties input:

The details of the reinforcing bars are now added in the group table.  Note that:

  • The bar data overwrites the data for the concrete.
  • The X and Y offsets are defined so that the centre of all the bars is on the Y axis at the required level (in this case 450 mm – 50 mm cover -24 mm bar diameter).
  • The individual bars are defined by a rotation angle about the origin.
  • The elastic modulus is defined as the modulus for steel/concrete (200/30) -1, because the steel is displacing concrete.

After entering the required details click the “Add shapes to group” button.  The Group Properties table will update:

The combined shape and group properties can now be seen on the “Coords_Group” sheet; click the “Recalc Group Properties” button, then the “Plot Group” button:

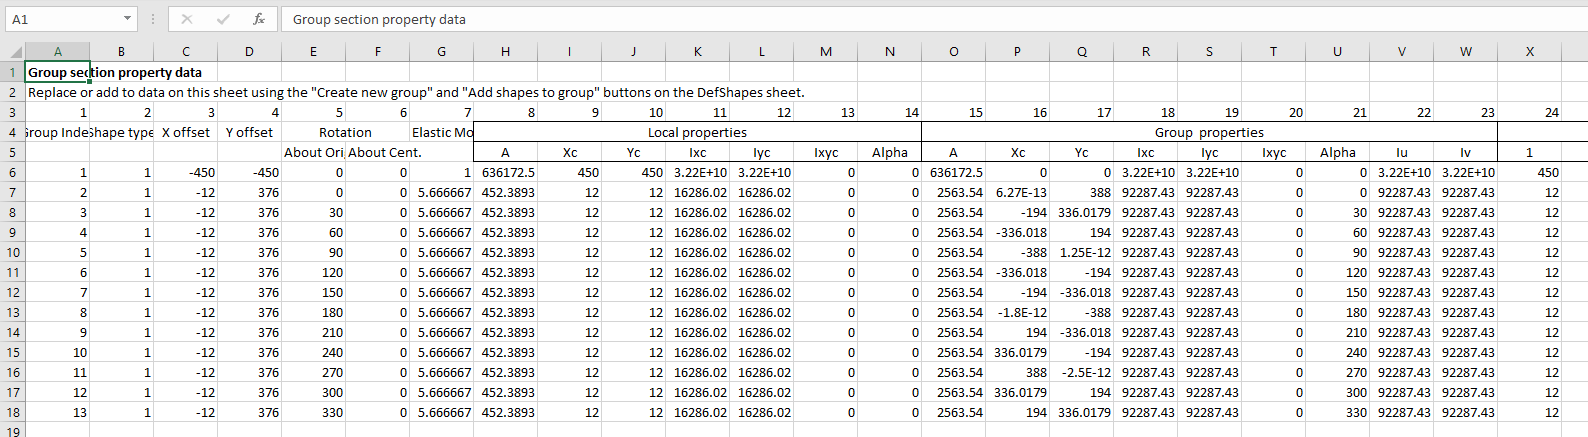
Details of each shape can also be viewed on the “Group data” sheet.  This table should always be checked to ensure that the correct number of elements are included.  Note that if shapes are accidentally added twice at the same location, this will not be obvious on the plot, but they will appear twice in the group data table.

The shape can also be modified by adding additional groups, or subtracting shapes using a negative elastic modulus.  In the example below the section properties are adjusted for the bottom region of the concrete being in tension, and therefore deducted from the concrete area.  The tension region is defined as a circular segment with a chord angle of +- 60degrees from the X axis:

This is then entered in the group table, rotated  through -90 degrees, so that the chord is parallel to the X axis:

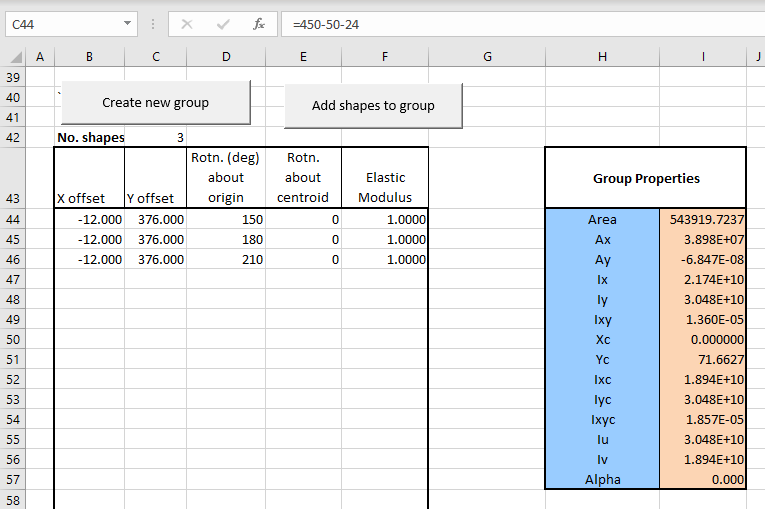
Finally the three  reinforcement bars now in the tension zone are no longer displacing active concrete, so the area of these bars should be  added back, with an elastic modulus of 1:

The revised cross-section and section properties may now be plotted on the Coords_Group sheet:

Posted in Coordinate Geometry, Excel, Maths, Newton, Numerical integration, UDFs, VBA | Tagged , , , , , | 8 Comments