On not using Hungarian Notation, and VBA shortcuts

In June this year Michael Alexander at Bacon Bits had a post on using Hungarian Notation (or not).  It contained the following quote from Stackoverflow, which for me sums up excellently a good reason for not using it:

“vUsing adjHungarian nNotation vMakes nReading nCode adjDifficult”

But what really made the post useful for me was a comment from Freek van Gilst, who posted a couple of very useful keyboard short-cuts available in VBA:

 When you have the cursor on a variable you can press Ctrl-i to get a tooltip with the type (and scope).
Or press Shift-F2 to jump to the declaration (and Ctrl-Shift-F2 to return to your original position).

Posted in Excel, VBA | Tagged , , , | 1 Comment

The Countif bug (and how to avoid it)

The Countif function counts the number of cells in a range that match some criterion.  If we enter 1,2,3 in cells A1:A3 and enter =COUNTIF($A$1:$A$3,A1) somewhere else, it will return 1:

But if we enter three text strings with 16 or more numerical characters, that are only different in the 16th or later characters, COUNTIF will say they are all the same:

This problem was reported by John Walkenbach at Daily Dose of Excel, back in 2006.  The solution given then used the SUM function as an array function: =SUM((A1:A3=A1)*1).  The alternative shown below gives the same results.  Note that using SUM the function must be entered as an array, using Ctrl-Shift-Enter.

An alternative that does not require array function entry is to use the SUMPRODUCT function:

But after 11 years Lori Miller returned to Daily Dose of Excel with a way to get COUNTIF to work correctly.  Precede the address of the criterion cell with CHAR(173)&:

CHAR(173) is a “soft hyphen” character, which will ensure that the contents of the data range are treated as text strings, rather than numbers, but is otherwise ignored.  Now all numeric text strings of any length may be entered, and they will only be counted as being the same if they really are.

Posted in Computing - general, Excel | Tagged , , , , , | 2 Comments

Excel Uservoice and Python for Excel

The Excel Uservoice site is a forum for users to post suggestions for improvements to Excel.  A suggestion to add native Python support to Excel, as a replacement to VBA, has had by far the most votes since the start, and now Microsoft are looking at implementing that proposal, and have posted a questionnaire, asking how people use Excel and Python in their work:  Python as an Excel scripting language.

The disappointing (but not very surprising) thing about the survey is that although it has several questions about areas of work, it does not use the words “engineer” or “engineering” once.  So all you engineering Excel users out there, please complete the survey, and let Microsoft know what you use Excel for.

_________________________________________________________

Has the free software at this site saved you time and/or money?
If so, please contribute to the Raw Impact charity group providing practical help to poor communities in Cambodia:

Everydayhero – Cambodia 2018

  • All contributions gratefully accepted.
  • Contributions are tax-deductible for Australian tax payers
Posted in Computing - general, Excel, Link to Python, VBA | Tagged , , , , | 1 Comment

Section Properties with MeshPY, including torsion and warping

I recently discovered robbie van leeuwen’s structural engineering blog, which has an open-source set of Python routines for calculation of section properties, including torsion and warping constants.  The program uses the MeshPY Library for generating the finite element meshes required for the torsion and warping calculations.   The Python code for generation of the input to MeshPY, and for carrying out the finite element analyses, is all by Robbie van Leeuwen.

I have written an Excel front-end for these routines, allowing most of the functionality to be accessed quickly and easily, with no programming required.  The spreadsheet, including full open source code, can be downloaded from:

xlwSectProp.zip

The spreadsheet requires the following software to be installed:

  • Windows version of Excel
  • Python version 2.7 or later (not checked with version 3)
  • xlwings version 0.11.4 or later
  • Matplotlib, Numpy and Scipy
  • The required MeshPY and other Python files are included with the download

The spreadsheet includes two calculation sheets:

  • Twelve defined shapes
  • Any shape defined by a series of coordinates

The screenshots below show the list of defined shapes and input and output for a rectangular hollow section:

Input cells are shaded blue.  Select a section type by number (1-12) and the required dimensions will update.  The optional input, Nu (Poisson’s Ratio) and mesh size (maximum area of each generated mesh element), is only required for the warping results.  The applied actions are only required for display of stress results.

The section properties output is shown in the two screen-shots below.  More detailed descriptions can be found at the on-line documentation.

For graphic display of the generated cross-section, element meshes, and stress plots under the input actions, click the “Display Stress Results” button:

17 images are shown in sequence in an external window.  Close each image to move on to the next.  There is currently no way to automatically save the images to the spreadsheet, but any image may be manually saved to disk as a png file.  At present each image must be viewed in sequence before control is returned to the spreadsheet.

The image window may be dragged to any required size (or made full-screen):

Stress distributions are generated for each of applied actions, and combined stresses:

The image window has tools to zoom and pan, and edit output format:

Sections defined by co-ordinates may be analysed on the second sheet.  The Python code has provision for analysis of sections with holes, but this is not yet implemented in the spreadsheet version:

The numerical results are as for the defined shapes:

The download file contains output for an asymmetrical I section, compared with the same section analysed in Strand7.  The geometric results are in exact agreement, to machine accuracy, except for the plastic modulus results, which have larger, but still very small differences.  The shear area, and torsion and warping constants have larger differences, due to different implementations of the finite element analysis, but are generally within 1%.

The output torsion and shear stress results from the spreadsheet are compared below with the equivalent results from Strand7:

Posted in Beam Bending, Concrete, Excel, Finite Element Analysis, Frame Analysis, Link to Python, Maths, Newton, Numerical integration, NumPy and SciPy, Strand7, UDFs, VBA, xlwings | Tagged , , , , , , , , | 11 Comments

Brent’s Method; Update and Examples

Brent’s Method is a refinement of Newton’s Method for the numerical solution of any equation with one variable.  The User Defined Function (UDF) QuadBrent was described in:  The Inverse Quadratic Method 3 – Brent’s Method

Following a recent question, I have updated the function and added some simple examples and additional documentation, linking to the Wikipedia article.  The new spreadsheet can be downloaded from:

ItSolve.zip

The main update is that in addition to calling a VBA function to solve, the equation may be entered as text on the spreadsheet.  There is also a new function, QuadBrentT, for which this option is the default.

A simple example, solving a trigonometric equation, is shown in the screen-shot below (click on any image for full size view):

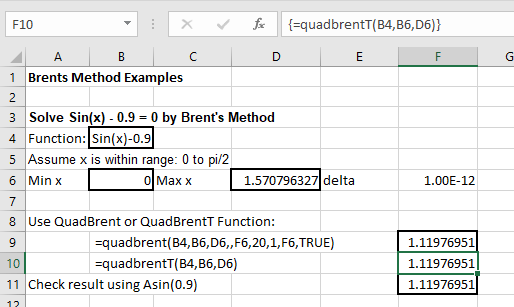
The function to be solved is entered as text in cell B4.  Using the original QuadBrent function, the default function type is the name of a VBA function.  To solve a text function on the spreadsheet, the new “EvalTxt” argument must be set to True.  The full list of arguments is now:

QuadBrent(Func, Ak, Bk, Coefficients, YTol , MaxIts , Subr, XTol, EvalTxt , ParamA , SolveFor )

  • Func: Name of VBA function, or function entered as text on the spreadsheet
  • Ak: Minimum x value
  • Bk: Maximum x value
  • Coefficients: value of fixed parameters used in the function; default = none
  • Ytol: solution tolerance on Y value; default = 1E-12
  • MaxIts; maximum iterations, default = 20
  • Subr: solution type; 1= Inverse Quadratic (default), 2 = Quadratic
  • XTol: solution tolerance on X value; default = 1E-12
  • EvalTxt: evaluate the entered text string; default = False
  • ParamA; list of fixed parameters (required if EvalTxt = True only); default = none
  • SolveFor: variable character (required if EvalTxt = True only); default = “x”

For the new QuadBrentT function the argument order and defaults are changed for greater convenience when evaluating text functions on the spreadsheet:

QuadBrentT(Func, Ak, Bk, ParamA, Coefficients, SolveFor, YTol , MaxIts , Subr, XTol )

Arguments are as listed above, except EvalTxt is no longer required, since it is always true.

In this example the solution to the equation could of course easily be found using the ASin function, but the method is easily applied to more complex equations, as shown below:

In this case two additional array arguments are required: the symbols representing constant values, and their associated values.

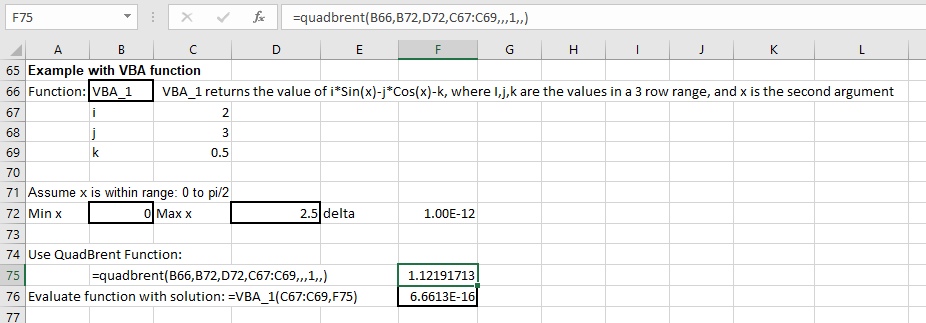
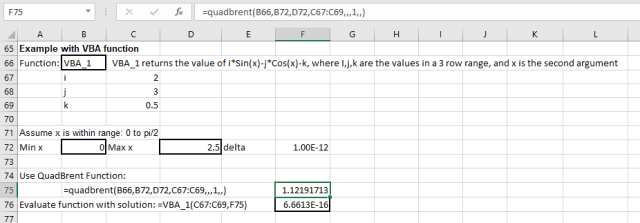
The next example illustrates the use of the QuadBrent function calling a VBA function to solve the same equation as above.  The code for VBA_1 is:

Function VBA_1(Coeffa As Variant, x As Double)
VBA_1 = Coeffa(1, 1) * Sin(x) - Coeffa(2, 1) * Cos(x) - Coeffa(3, 1)
End Function

Note that all required data must be passed as a single variant array, followed by the function variable.

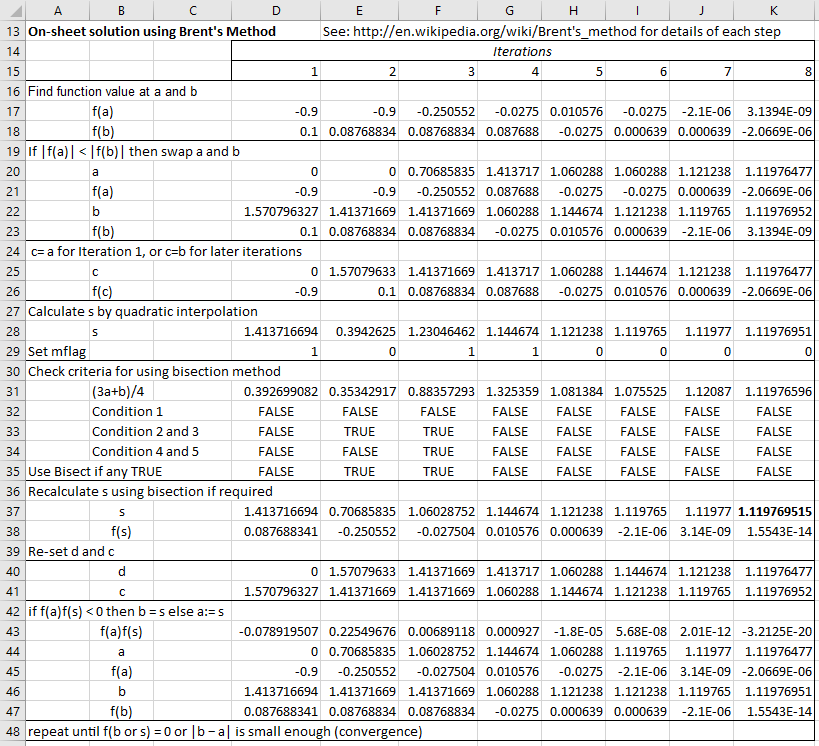
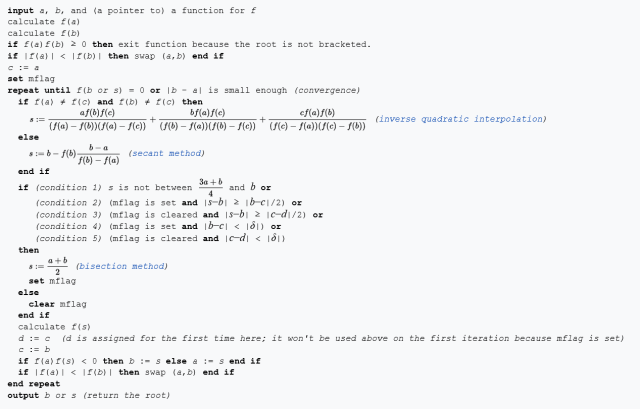
The algorithm for Brent’s Method (taken from the Wikipedia page) is shown below:

This is applied to the first simple example on the spreadsheet, showing the results for each step of each iteration:

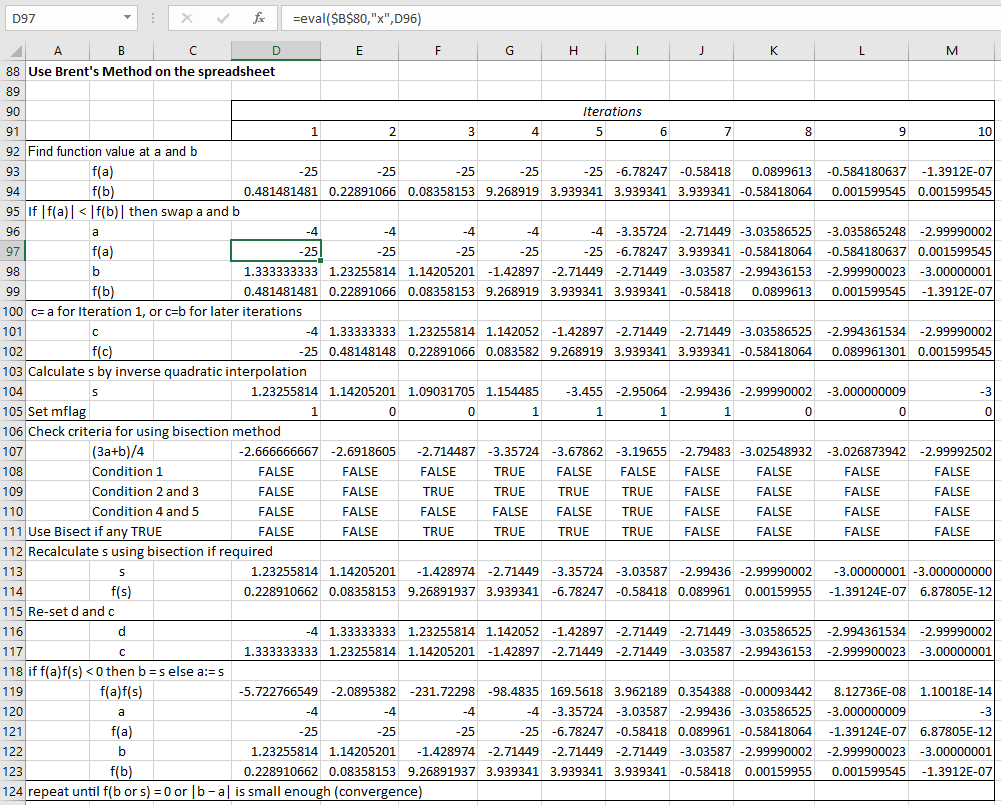
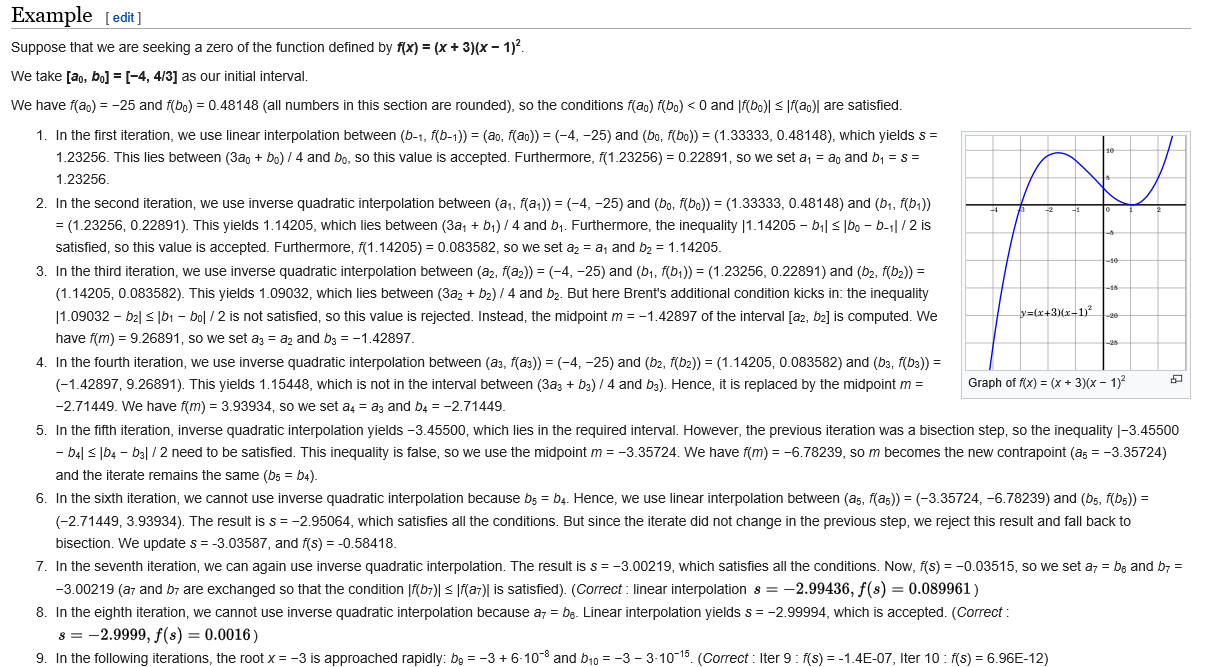
The Wikipedia page has a more complex example, solving a cubic equation.  This is solved with the QuadBrentT function below, and also with the Cubic UDF:


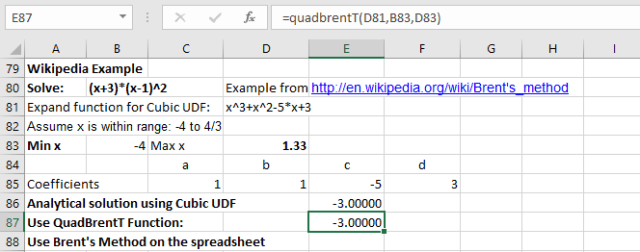
The step by step method is also shown on the spreadsheet:

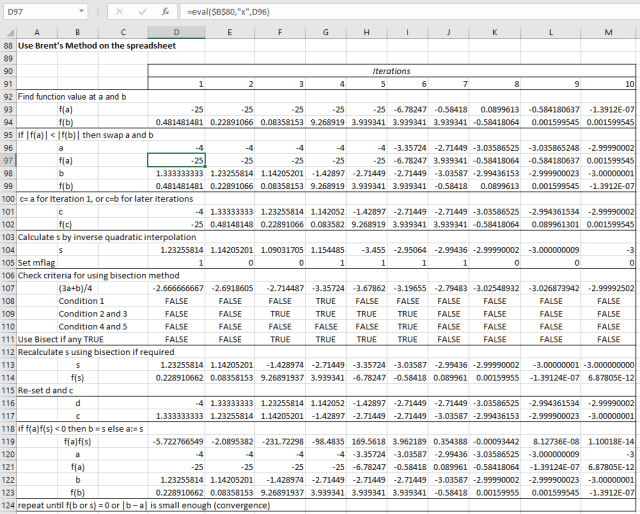
This can be compared with the listing of the results at each iteration on the Wikipedia page:

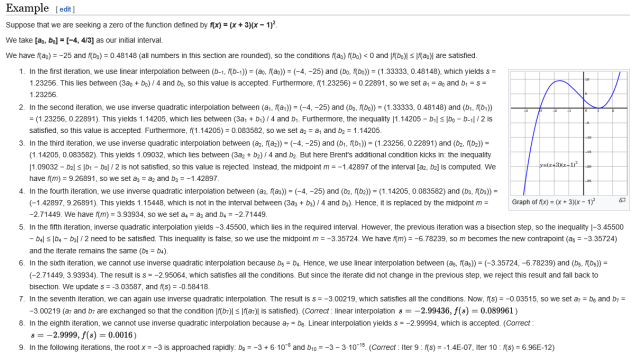
Not that, at the time of writing, steps 7 to 9 have corrected results shown at the end of the line, and these corrected values agree with the spreadsheet results shown above.

Posted in Arrays, Excel, Maths, Newton, UDFs, VBA | Tagged , , , , , , | 5 Comments