Concrete Stress Blocks

Back in 2010 and 2011 posts here looked at a comparison of alternative stress blocks in the then new AS 3600, and a procedure for calculating parameters for a rectangular stress block exactly equivalent to the Eurocode 2 parabolic-rectangular stress block.

Associated downloads are:

I have now updated the stress block comparisons using the factors in the 2018 version of AS 3600, comparing 3 stress blocks:

  • AS 3600 2019, including new stress block factors and capacity reduction factors.
  • A rectangular stress block equivalent to the Eurocode 2 parabolic-rectangular stress block (labelled AS 3600-P2 in the graphs below).
  • The AS 5100 – 2017 rectangular stress block, which is exactly equivalent to the AS 3600 – 2010 version (including corrections to the 2009 version).

The graphs below are for the following cross section:

  • Rectangular section, 1000 mm wide x 350 mm deep
  • Compression steel = 10 bars, 16 mm diameter with 40 mm cover
  • Tension steel = 10 bars, 20 mm diameter with 40 mm cover

Results below plot axial load against bending moment for a range of concrete strengths, with and without capacity reduction factors:

At 32 MPa  the unfactored results from the two rectangular stress blocks are close, with the new AS 3600 being slightly more conservative at mid to high axial loads.  The P2 results are significantly higher in this range.

At 50 MPa  the difference between  the two rectangular stress blocks increases, and the increase in strength for the P2 results is also greater.

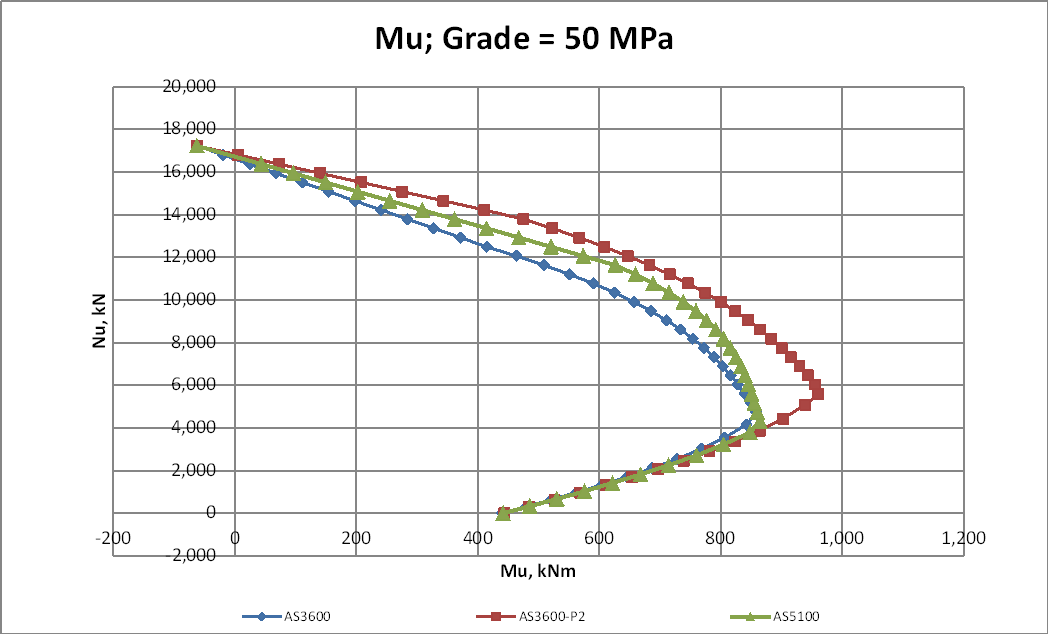
At 65 MPa the AS 5100 and the P2 results are very close over the full range.  The new AS 3600 results are again lower for axial loads above the balance point.

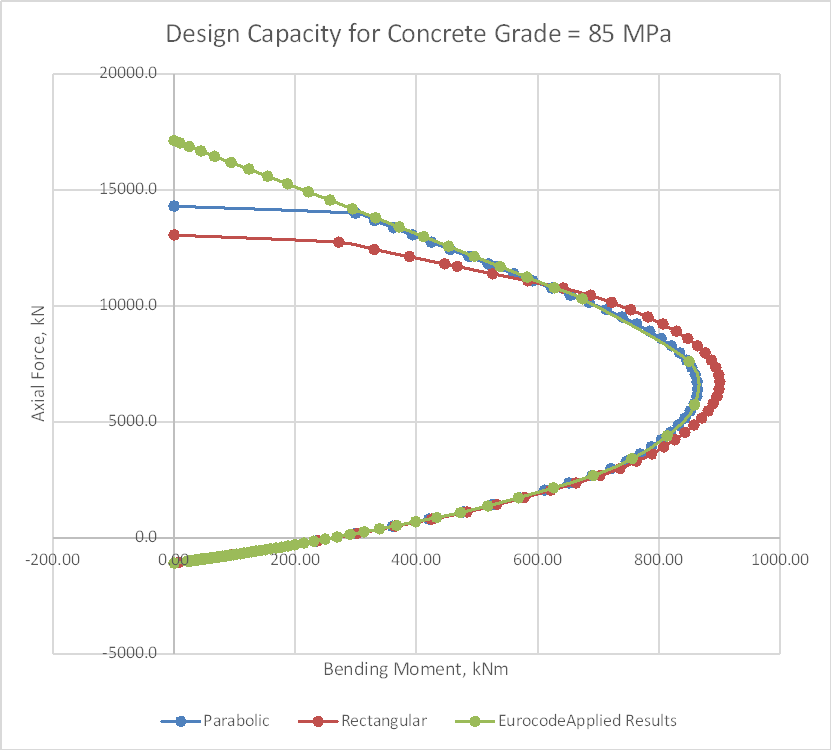
At 90 MPa all three results are close over the full range:

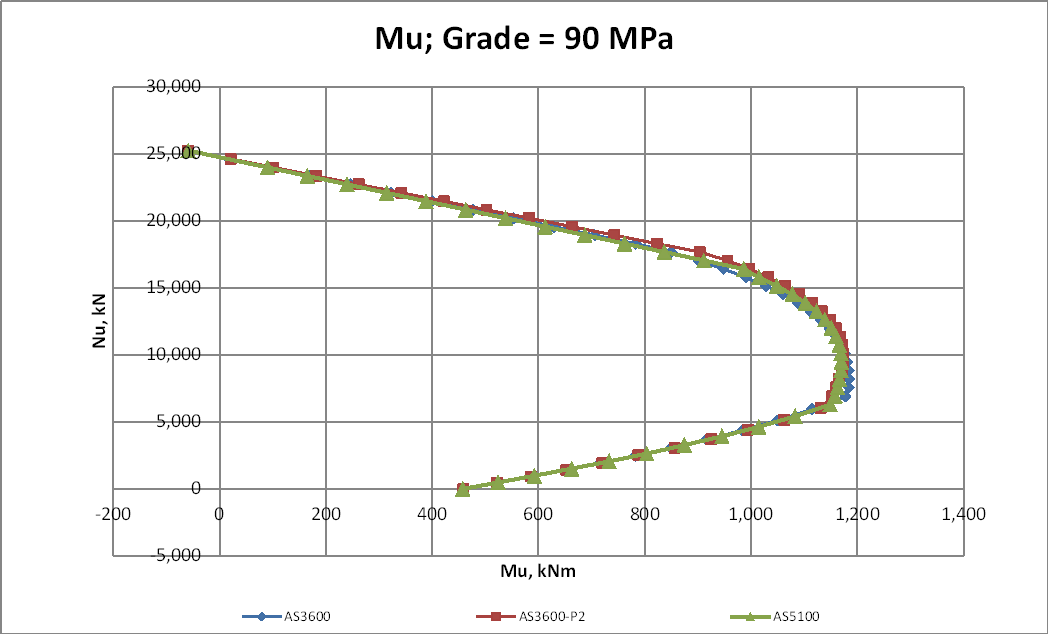
The new AS 3600 capacity factors (Phi) are increased as follows:

  • For no axial load (or tension) the factor is increased from 0.8 to 0.85 (for normal ductility steel)
  • For axial loads above the balance point the factor is increased from 0. 6 to 0.65 when the ratio of live load to dead load (Q/G) is 0.25 or greater.
  • The transition between the two factors is unchanged.

In the graphs below the new factors are applied to the AS 3600 and P2 results, but the AS 5100 results use the old factors.

With Q/G = 0

With 50 MPa concrete the new code results are slightly greater than AS 5100 for low axial loads, but remain significantly more conservative for axial loads above the balance point.  The P2 results are greater than AS 5100 over the full range:

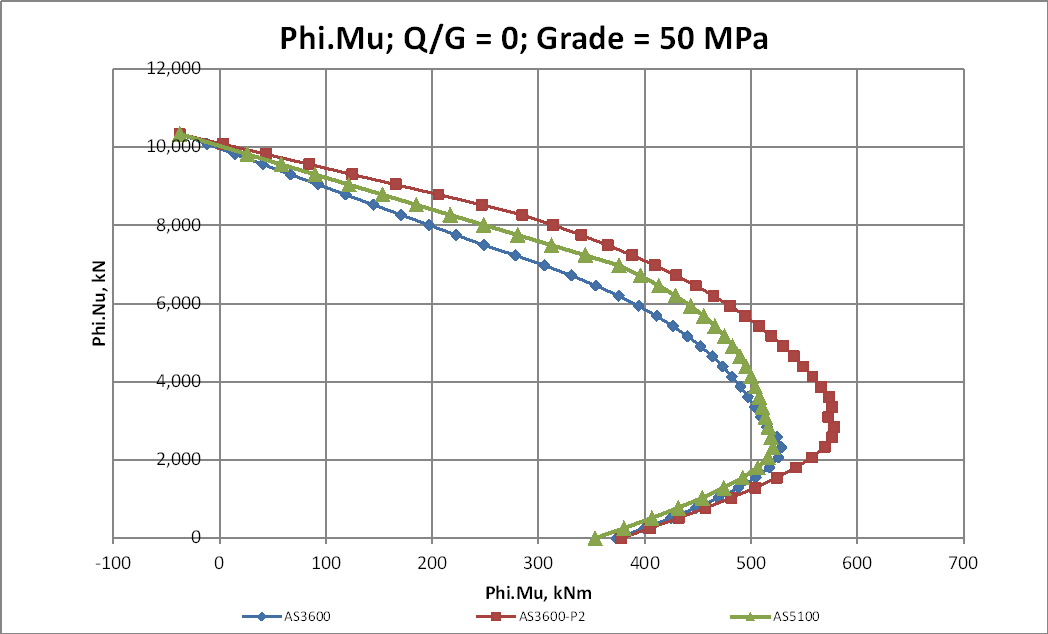
At 90 MPa all three curves are similar above the balance point, but the AS 3600 and P2 results are greater for low axial loads:

For a Q/G of 0.25 or greater the increased Phi factor makes the new AS 3600 results greater than AS 5100 over the full range.  The P2 results are equal to AS 3600 for low axial loads, and significantly higher at mid to high axial loads:

At 90 MPa with Q/G = 0.25 or more the AS 3600 and P2 results are close over the full range, with the AS 5100 results lower at all axial loads:

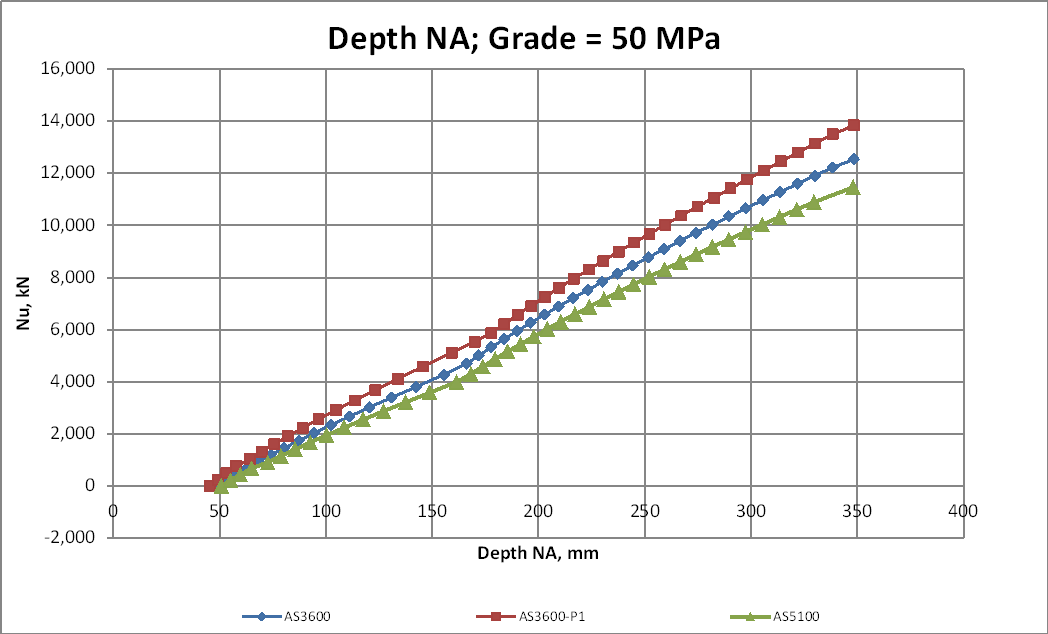
The graphs below show the concrete contribution to the bending moment, and the depth of the Neutral Axis, for axial loads up to the decompression point (neutral axis at the “tension” face), for 50 MPa concrete.

Compared with the P2 curve:

  • The AS 5100 curve reaches the decompression point at a much lower axial load.  Bending moments are slightly lower over the full range.
  • The AS 3600 curve has a higher axial load than AS 5100 at the decompression point, but is still significantly lower than the P2 curve, and bending moments are much lower for axial loads above the balance point:

Posted in Beam Bending, Concrete, Excel, Newton | Tagged , , , , , , , , , | 1 Comment

Deflections and Moments in Rectangular Plates

Following a question here I have compared tabulated coefficients for deflections and bending moments in a rectangular plate with results of a Strand7 analysis using 8 noded plate/shell elements.  The results are summarised below, and in a spreadsheet which also includes copies of the tabular data:
Plate def res

The sources of the tables were:

  • Theory of Plates and Shells by Timoshenko and Woinowsky-Krieger Download
  • Roark’s Formulas for Stress and Strain
  • Formulas for Stress, Strain, and Structural Matrices by W.D. Pilkey
  • The B.O.R Engineering Monograph No. 27 by W.T. Moody Download

For the purposes of comparison, a rectangular steel plate, restrained against deflection and moment on all four sides was analysed with a uniform load of 1 kPa.  Dimensions and material properties are shown in the screenshot below, together with the results of the Strand7 analysis:

The factors from the four sources are shown below:

Note that:

  • The Pilkey factors are given in the form of a cubic of alpha (a/b)
  • The first Pilkey factor for C5 (shown bold) is shown as 0.4247 in the text, but this appears to be an error (10 times too high).
  • The Roark and Pilkey factors for deflection incorporate the parameter D, which is applied separately by Timoshenko.
  • The Roark factors Beta1 and Beta2 are to calculate stress, rather than bending moment.
  • The Moody factors are for reinforced concrete, rather than steel, and are based on a Poisson’s Ratio of 0.2, rather than 0.3.

The deflections and bending moments derived from these factors are shown below for a/b = 1, compared with the Strand7 results:

a/b = 2

  • The Timoshenko deflection results are in good agreement with the Strand7 results, the Roarke deflections are 3% greater than Strand7 for a/b = 2, and the Pilkey deflections are 6% less for a/b =1.
  • All the Mx results were within 2% of the Strand7 results, and the Timoshenko and Roark results were in exact agreement with each other, to 3 significant figures.
  • There were significant differences in the My results, with Timoshenko moments up to 9% greater than Strand7, Pilkey results up to 11% greater and 20% less, and Moody up to 28% less.

Differences between the Moody results and the other factors are expected, since they are based on a numerical analysis, and used a different Poisson’s ratio, but the differences between the Timoshenko and Pilkey My results are surprising.

The source of the cubic equations defining the Pilkey factors is not given, but it seems likely  they are based on fitting a cubic curve to tabulated values over the a/b range of 1 to 2.  The source of the tabulated values is not given, but does not appear to be Timoshenko.  The screenshot below shows curves fitted to the Timoshenko and Pilkey factors for central Mx, using the Excel Linest function.  Although the tabulated coefficients are all within 3%, the coefficients for the fitted cubic curves are very different:


Posted in Beam Bending, Curve fitting, Excel, Finite Element Analysis, Newton | Tagged , , , , , , , , , , | 7 Comments

Section Properties for Rotated Shapes

I have just posted an update to my section properties spreadsheet, last discussed at:
Using Section Properties- Group

The new version can be downloaded from:

Section Properties07-Group.zip

The main sheet provides section properties for a wide variety of defined shapes:

This sheet provides second moment of area about the X and Y axes, and about the shape centroid, but not about the principal axes.

This data can be calculated by going to the Coords_Shape sheet, and clicking the “Copy Shape Coordinates” and “Plot Coordinates” buttons:

This now calculates the second moment of area about the Principal Axes (Iu and Iv), but often it is useful to rotate the shape so that the principal axes are parallel to the X and Y axes.

This can be achieved by using the “grouped shapes” calculation. In the Group Properties table enter the “Rotation about centroid” value as – the calculated principal axis value, or enter a formula linking to the calculated alpha value (Cell I23), as shown below.  Then click the Create new group button:

The displayed properties now include Iu and Iv, which are now equal to Ixc and Iyc, and Ixyc is equal to zero.

The rotated shape can be plotted on the Coords_Group sheet, by clicking the Plot Group button:

The principal axes are now parallel to the X and Y axes.

It is also possible to move the section centroid to the XY origin, by entering the appropriate offsets in the Group Properties table, and clicking the Create new group button:

The section corner coordinates are now relative to the section centroid, allowing easy calculation of the section modulus values for any corner point.

Note that the code for calculation of the rotated section properties has now been corrected to fix a problem when the rotated Alpha angle is exactly zero, and to plot the principal axes correctly, so the latest version should be downloaded from the link at the top of the page.

Posted in Beam Bending, Coordinate Geometry, Excel, Frame Analysis, Maths, Newton, UDFs, VBA | Tagged , , , , | Leave a comment

More from Danny Thompson

… with two of his regular musical partners over the years.

Danny Thompson with Richard Thompson, The Ghost of You Walks:

and with John Martyn on The Old Grey Whistle Test in 1977; I Couldn’t Love You More:

Posted in Bach | Tagged , , , , , | Leave a comment

Reinforced Concrete Design for Circular Sections to Eurocode 2

As mentioned in the previous post, the Reinforced Concrete Design Functions spreadsheet includes a function for ULS analysis of circular sections, using either a rectangular  or a parabolic-linear stress block.  A new CircuPF function has now been added, for codes that follow a “partial factor” approach to the analysis, as in Eurocode 2.  The input for Eurocode 2 specified factors has also been modified, to allow more convenient input for different National Annex factors.  The new spreadsheet can be downloaded from:

RC Design Functions8

The Eurocode parameter input is shown below.  At present the only national annexes supported are the Default Eurocode values and the UK:

The output of the CircUPF function has been modified to show only values relevant to the Partial Factor analysis approach:


The graphs below show output comparing results from the spreadsheet, with the parabolic and rectangular stress blocks, with the results from the on-line analysis at EurocodeApplied,

When the rectangular stress block is specified the concrete stress is factored down by 0.9 by default, in accordance with the Eurocode 2 requirements for sections that reduce in width towards the compressive face.  For 32 MPa concrete:

  • The spreadsheet results with the parabolic stress block and EurocodeApplied results are in near exact agreement, except that the spreadsheet axial load is capped at the value that results in a moment capacity equal to the minimum eccentricity specified in the code.
  • With the default 0.9 reduction factor the rectangular stress block is conservative for all axial loads.

Removing the reduction factor the rectangular stress block becomes slightly unconservative at axial loads above the balance load:

For very high strength concrete (of less than 90 MPa strength) the spreadsheet parabolic stress block and EurocodeApplied results remain in excellent agreement.  The rectangular stress block results with 0.9m reduction factor are now conservative over the full range, with a reduction in capacity of more than 20% for high axial loads:

Removing the reduction factor the rectangular stress block results become significantly unconservative around the balance load, but remain conservative for high axial loads:

For a concrete strength of 90 MPa (the maximum covered by the current version of Eurocode 2) the spreadsheet gives results consistent with the code, but the EurocodeApplied results terminate at axial loads well below the section capacity (note that compressive axial loads are displayed as negative).

Reducing the concrete strength to 89 MPA generates results over the full range of axial loads:


Posted in Beam Bending, Concrete, Excel, Newton, UDFs, VBA | Tagged , , , , , , , , | 1 Comment