Import Data from a Picture to Excel

The myOnlineTraininghub blog recently had a post entitled
Import Data from a Picture to Excel
which sounded promising, since I often need to extract data from Autocad files saved to a pdf.

From the link, it seems that if I had a Mac with Excel365 then I could do that, but:

  • The app is not available for Windows
  • The versions for iPhone and Android work by switching to camera mode when you select the “import data” icon, so that you can take a picture of printed images.

First results from the Android version were disappointing.  This table from Roark’s Formulas for Stress and Strain:

was converted into this data:
No doubt more care with taking the original photo would help, but the ability to work with existing image files (including pdf) or screen shots, preferably from a Windows computer, would make the whole process a lot easier and more reliable.

I’ll keep an eye on new developments, but at the moment it seems more trouble than it is worth.

Posted in Computing - general, Excel | Tagged , , , | 1 Comment

Wembley Tower 2

Following from the previous post, nearly all of the 68 designs for the Wembley Tower were in steel or iron, but there was just one with a truly unique design feature, it was to be built of concrete:

If it had won the competition, and been successfully completed, it would have been by far the tallest concrete structure in the World, and would have remained so until the completion of the Toronto Tower over 80 years later:

Posted in Concrete, Newton | Tagged , , | Leave a comment

The Wembly Tower

Late in the 19th Century a group of Londoners decided that London should have a tower taller and grander than the Eiffel Tower.  A competition was held, and construction started at the then rural area near Wembly, but construction and financial difficulties led to the cancellation of the project when it had only reached 47 metres height.  “The London Stump” was eventually blown up and sold for scrap in 1904.

The document detailing all 68 entries to the competition can now be viewed on-line:

A catalogue of the 68 competitive designs for the great tower for- London 1890

The link above has a copy of the complete competition catalogue, including drawings and descriptive text of each entry:

Also see: A Doomed Attempt at Out-Eiffelling Eiffel for images and commentary on a selection of the entrants.

Posted in Newton | Tagged , , | Leave a comment

Concrete Stress Blocks

Back in 2010 and 2011 posts here looked at a comparison of alternative stress blocks in the then new AS 3600, and a procedure for calculating parameters for a rectangular stress block exactly equivalent to the Eurocode 2 parabolic-rectangular stress block.

Associated downloads are:

I have now updated the stress block comparisons using the factors in the 2018 version of AS 3600, comparing 3 stress blocks:

  • AS 3600 2019, including new stress block factors and capacity reduction factors.
  • A rectangular stress block equivalent to the Eurocode 2 parabolic-rectangular stress block (labelled AS 3600-P2 in the graphs below).
  • The AS 5100 – 2017 rectangular stress block, which is exactly equivalent to the AS 3600 – 2010 version (including corrections to the 2009 version).

The graphs below are for the following cross section:

  • Rectangular section, 1000 mm wide x 350 mm deep
  • Compression steel = 10 bars, 16 mm diameter with 40 mm cover
  • Tension steel = 10 bars, 20 mm diameter with 40 mm cover

Results below plot axial load against bending moment for a range of concrete strengths, with and without capacity reduction factors:

At 32 MPa  the unfactored results from the two rectangular stress blocks are close, with the new AS 3600 being slightly more conservative at mid to high axial loads.  The P2 results are significantly higher in this range.

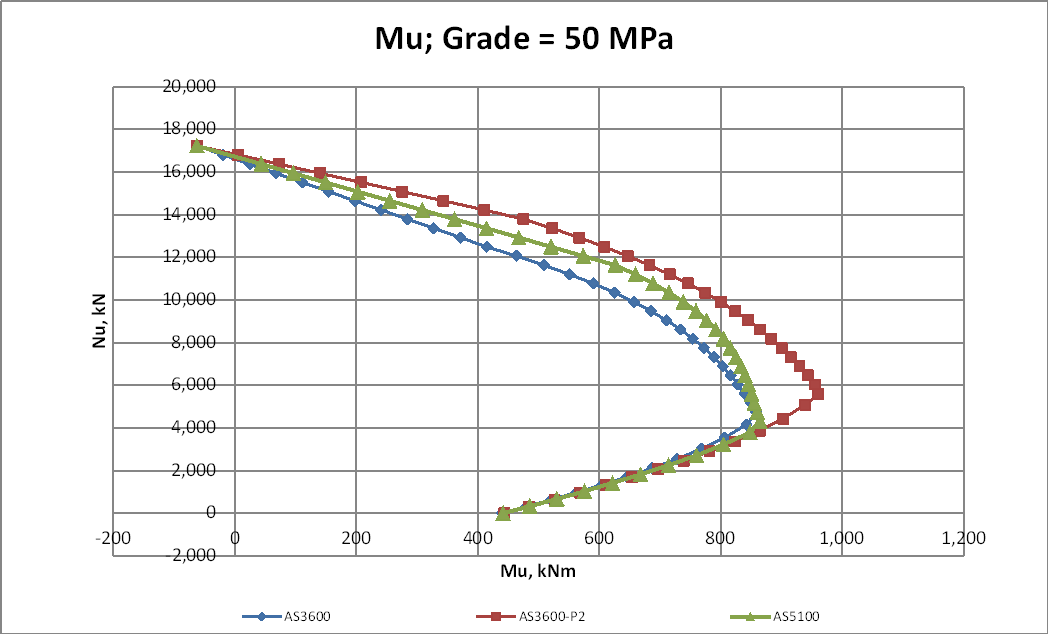
At 50 MPa  the difference between  the two rectangular stress blocks increases, and the increase in strength for the P2 results is also greater.

At 65 MPa the AS 5100 and the P2 results are very close over the full range.  The new AS 3600 results are again lower for axial loads above the balance point.

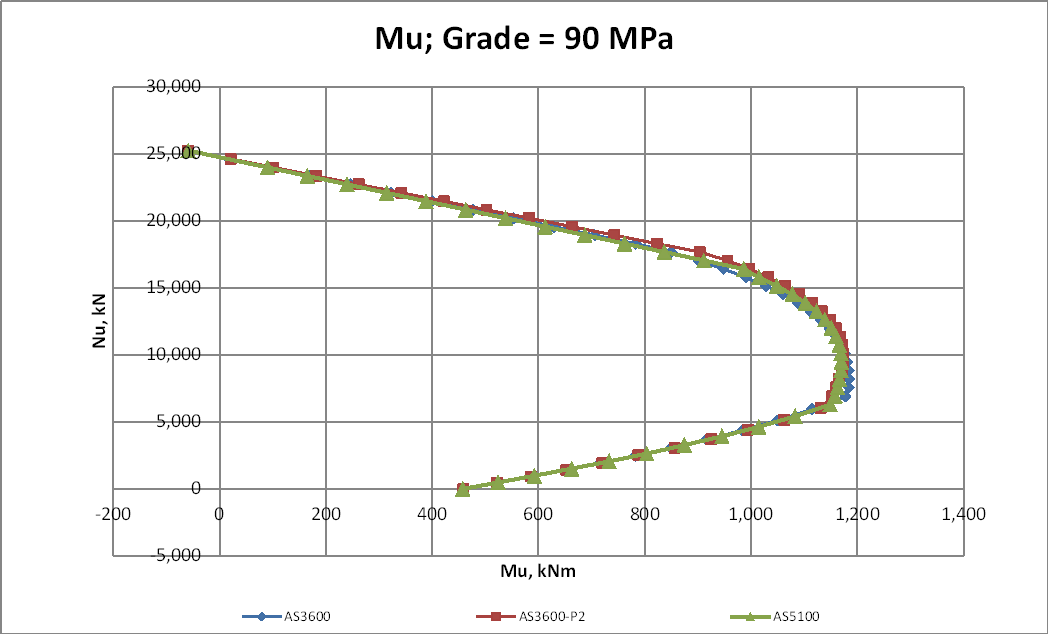
At 90 MPa all three results are close over the full range:

The new AS 3600 capacity factors (Phi) are increased as follows:

  • For no axial load (or tension) the factor is increased from 0.8 to 0.85 (for normal ductility steel)
  • For axial loads above the balance point the factor is increased from 0. 6 to 0.65 when the ratio of live load to dead load (Q/G) is 0.25 or greater.
  • The transition between the two factors is unchanged.

In the graphs below the new factors are applied to the AS 3600 and P2 results, but the AS 5100 results use the old factors.

With Q/G = 0

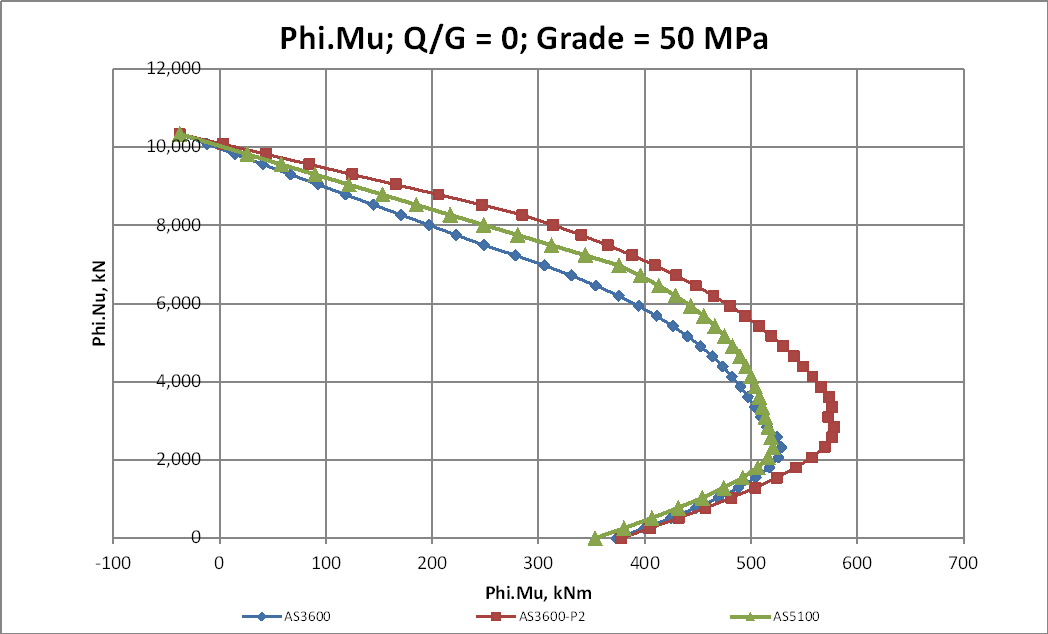
With 50 MPa concrete the new code results are slightly greater than AS 5100 for low axial loads, but remain significantly more conservative for axial loads above the balance point.  The P2 results are greater than AS 5100 over the full range:

At 90 MPa all three curves are similar above the balance point, but the AS 3600 and P2 results are greater for low axial loads:

For a Q/G of 0.25 or greater the increased Phi factor makes the new AS 3600 results greater than AS 5100 over the full range.  The P2 results are equal to AS 3600 for low axial loads, and significantly higher at mid to high axial loads:

At 90 MPa with Q/G = 0.25 or more the AS 3600 and P2 results are close over the full range, with the AS 5100 results lower at all axial loads:

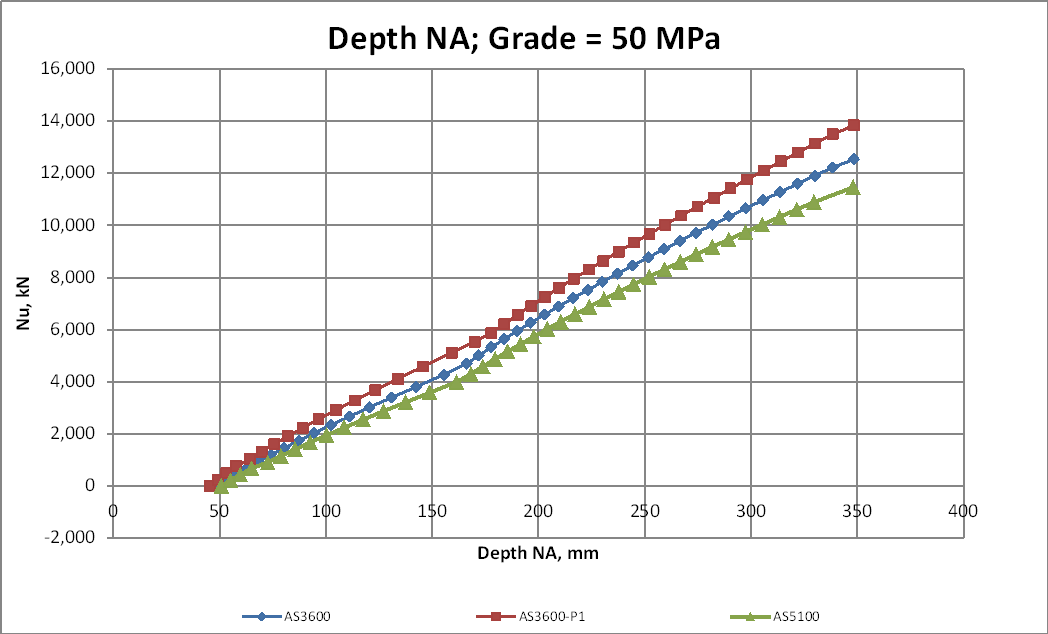
The graphs below show the concrete contribution to the bending moment, and the depth of the Neutral Axis, for axial loads up to the decompression point (neutral axis at the “tension” face), for 50 MPa concrete.

Compared with the P2 curve:

  • The AS 5100 curve reaches the decompression point at a much lower axial load.  Bending moments are slightly lower over the full range.
  • The AS 3600 curve has a higher axial load than AS 5100 at the decompression point, but is still significantly lower than the P2 curve, and bending moments are much lower for axial loads above the balance point:

Posted in Beam Bending, Concrete, Excel, Newton | Tagged , , , , , , , , , | 1 Comment

Deflections and Moments in Rectangular Plates

Following a question here I have compared tabulated coefficients for deflections and bending moments in a rectangular plate with results of a Strand7 analysis using 8 noded plate/shell elements.  The results are summarised below, and in a spreadsheet which also includes copies of the tabular data:
Plate def res

The sources of the tables were:

  • Theory of Plates and Shells by Timoshenko and Woinowsky-Krieger Download
  • Roark’s Formulas for Stress and Strain
  • Formulas for Stress, Strain, and Structural Matrices by W.D. Pilkey
  • The B.O.R Engineering Monograph No. 27 by W.T. Moody Download

For the purposes of comparison, a rectangular steel plate, restrained against deflection and moment on all four sides was analysed with a uniform load of 1 kPa.  Dimensions and material properties are shown in the screenshot below, together with the results of the Strand7 analysis:

The factors from the four sources are shown below:

Note that:

  • The Pilkey factors are given in the form of a cubic of alpha (a/b)
  • The first Pilkey factor for C5 (shown bold) is shown as 0.4247 in the text, but this appears to be an error (10 times too high).
  • The Roark and Pilkey factors for deflection incorporate the parameter D, which is applied separately by Timoshenko.
  • The Roark factors Beta1 and Beta2 are to calculate stress, rather than bending moment.
  • The Moody factors are for reinforced concrete, rather than steel, and are based on a Poisson’s Ratio of 0.2, rather than 0.3.

The deflections and bending moments derived from these factors are shown below for a/b = 1, compared with the Strand7 results:

a/b = 2

  • The Timoshenko deflection results are in good agreement with the Strand7 results, the Roarke deflections are 3% greater than Strand7 for a/b = 2, and the Pilkey deflections are 6% less for a/b =1.
  • All the Mx results were within 2% of the Strand7 results, and the Timoshenko and Roark results were in exact agreement with each other, to 3 significant figures.
  • There were significant differences in the My results, with Timoshenko moments up to 9% greater than Strand7, Pilkey results up to 11% greater and 20% less, and Moody up to 28% less.

Differences between the Moody results and the other factors are expected, since they are based on a numerical analysis, and used a different Poisson’s ratio, but the differences between the Timoshenko and Pilkey My results are surprising.

The source of the cubic equations defining the Pilkey factors is not given, but it seems likely  they are based on fitting a cubic curve to tabulated values over the a/b range of 1 to 2.  The source of the tabulated values is not given, but does not appear to be Timoshenko.  The screenshot below shows curves fitted to the Timoshenko and Pilkey factors for central Mx, using the Excel Linest function.  Although the tabulated coefficients are all within 3%, the coefficients for the fitted cubic curves are very different:


Posted in Beam Bending, Curve fitting, Excel, Finite Element Analysis, Newton | Tagged , , , , , , , , , , | 7 Comments