Building dances to an earthquake’s beat

Adam Pascale from the Seismology Research Centre recently shared this animation (click on controls bottom right for High Quality and Full Screen views):

… it’s from a building in the Philippines about 130km (hypocentral distance) from a magnitude 6.1 earthquake in April 2019. There were three high resolution strong motion accelerographs (SMA-HR) installed in the building according to local government regulations for structural monitoring – one in the lowest basement, one in the middle floor, and one below roof level.

My colleague and fellow SRC seismologist Santi (Juan Santiago Velasquez) has done a great job at visualising this data in an animation where the horizontal motion of each SMA-HR has been superimposed on top of each other to see the relative movement of each monitoring point. Hopefully you can view the attached video file.

The blue dot represents the SMA-HR in the lowest basement (6 levels below ground level), the green dot the instrument on the 9th floor, and the red dot the instrument on the 18th floor. The data has been converted to displacement and the plotting scale is millimetres, so we’re not talking a lot of motion, but it’s still very clear because of the use of low noise sensors. These dancing dots are an accessible and entertaining way to use seismic data to visualise the synchronised movement of a building during an earthquake.

Posted in Animation, Computing - general, Newton | Tagged , | Leave a comment

More from Malinda …

… and some of her mates, from here and there:

Posted in Bach | Tagged , , | Leave a comment

New sort functions and sorting to groups

I first posted a user defined function (UDF) to sort spreadsheet or VBA data back in 2009.  Finally Microsoft have caught up, and Excel 365 subscribers now have two built in sort functions available:

=SORT(array,[sort_index],[sort_order],[by_col])
=SORTBY(array, by_array1, [sort_order1], [by_array2, sort_order2],…)

As an example of using the new functions I have looked at options or sorting a list into groups from Eng_Tips:

I have a long list of unique data in excel in the following form. As a first step I removed all the duplicates.
The unique headings always start with a “$_”. There are many more unique headings in the list other than GRIDS and MATERIALS.
I would like to filter the Original List, such that each data entry under a unique heading is merged under a single heading.

The examples shown below, including open source VBA code, can be downloaded from:
GroupSort.xlsb

The screenshots below show two options for performing this sort, using the Sort and Sortby functions:

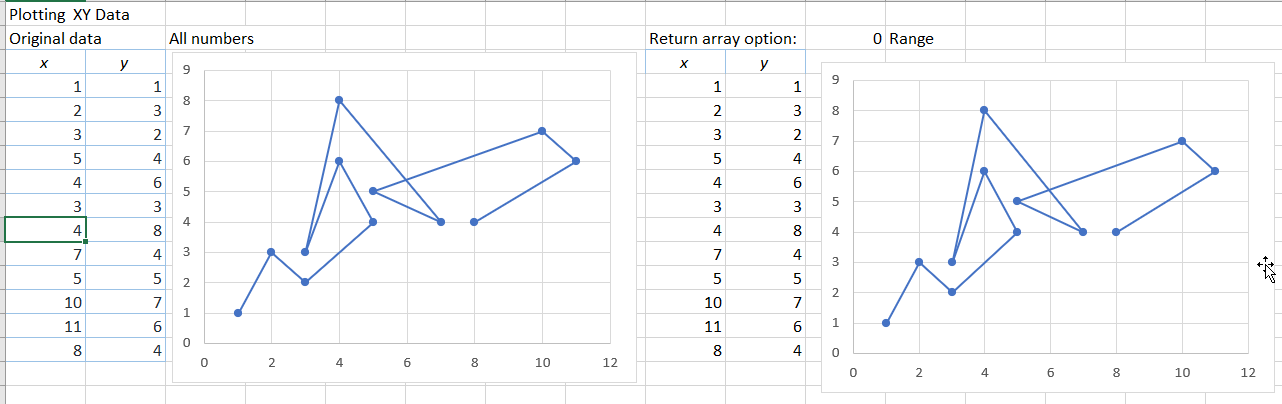
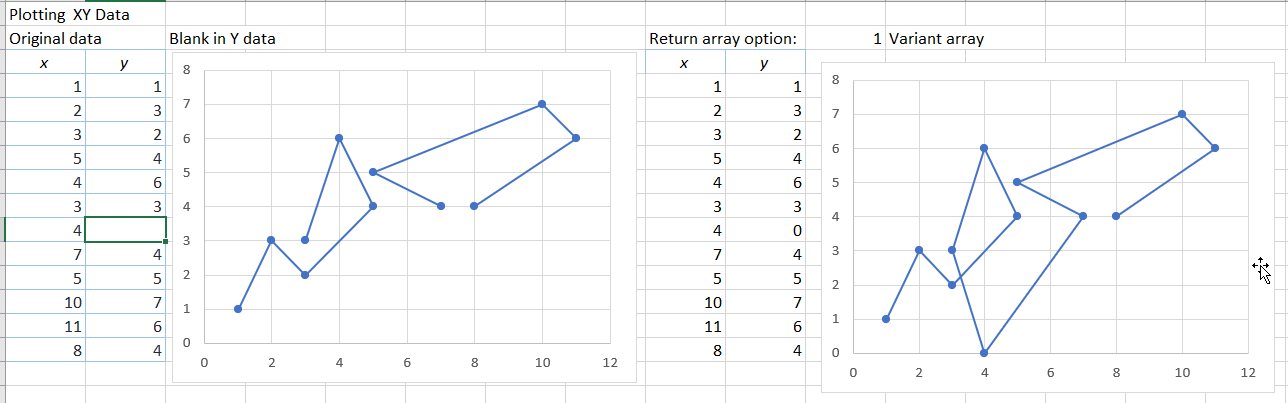
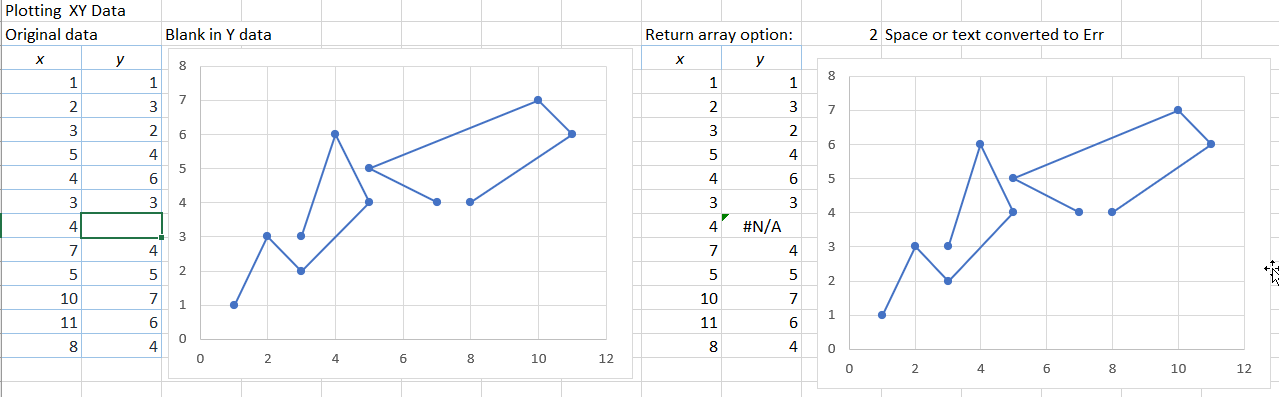
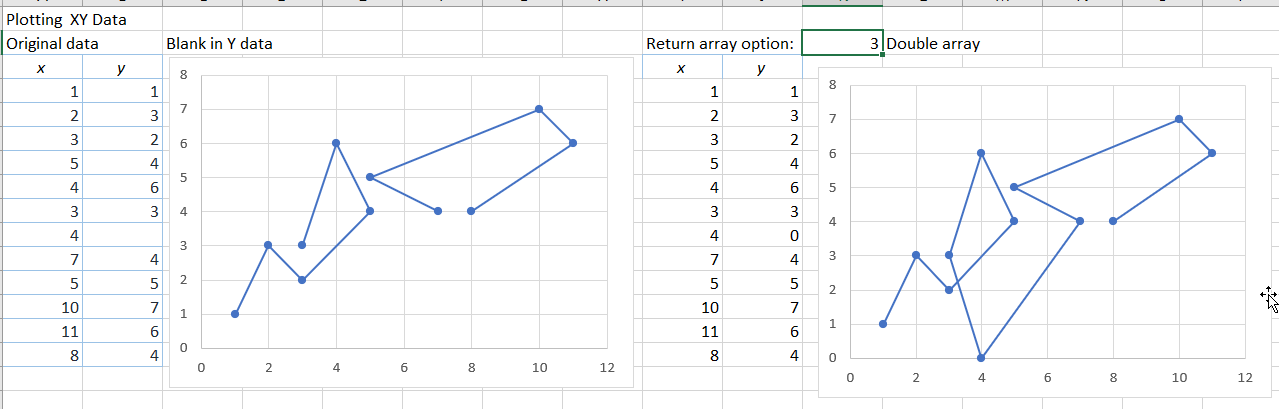
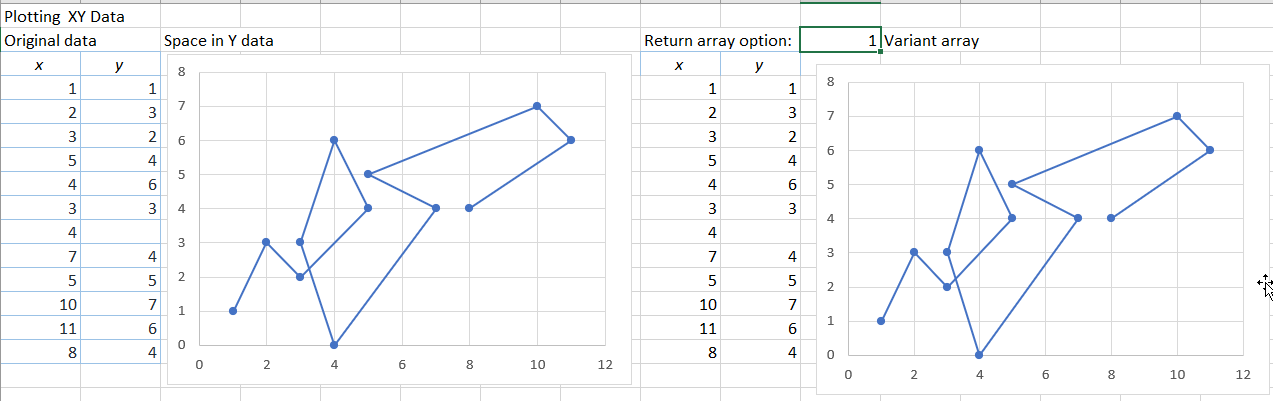
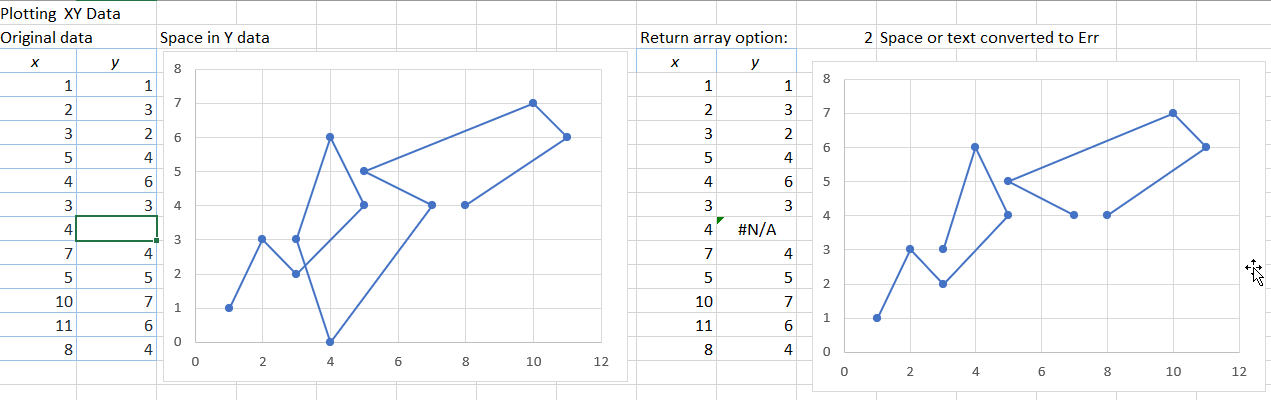
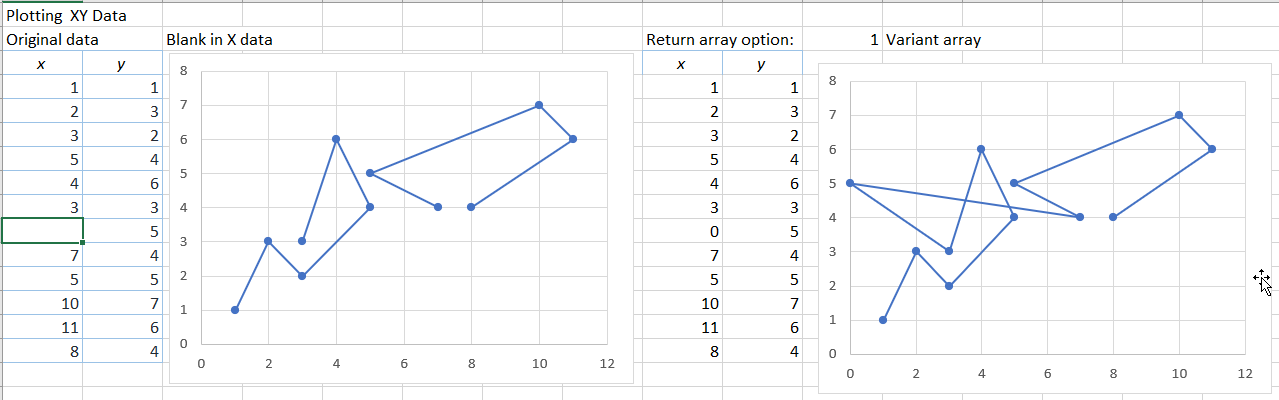
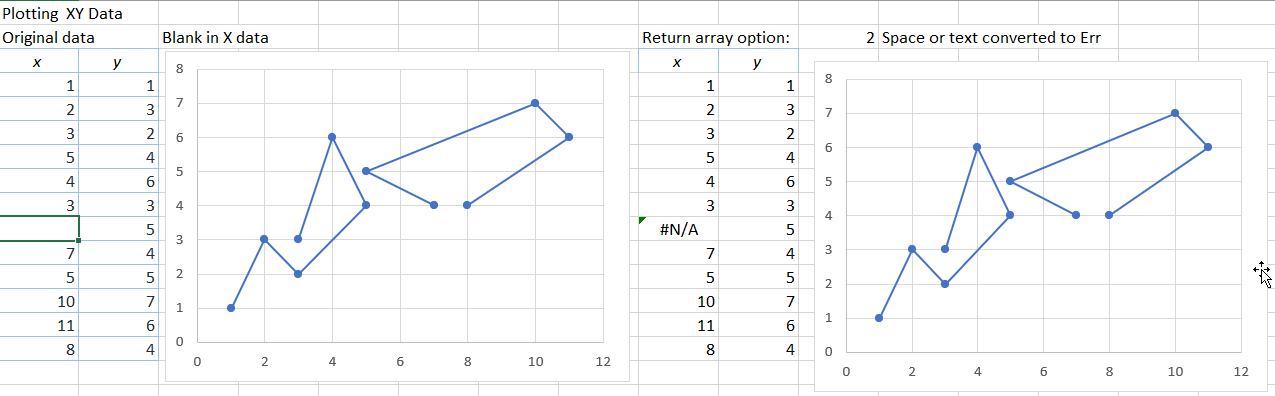
The data to be sorted consists of group names, preceded by a $, followed members of the group.  To sort the data into continuous lists for each group requires a “helper column” showing the current group name for each row (see cell B4).  The data can then be sorted first by Column B, then Column A.  The sort function returns both columns, and every instance of the group name (and also every instance of group members, if these have been duplicated).

Tidier results can be returned using Sortby:

The Sortby function returns only the data to be sorted (specified in the first argument), and allows any number of “sort by columns”.  In this case Column B then Column A are specified.  The Unique function has been added to remove all duplicate elements.

For those who don’t yet have the sort functions, and to avoid the need for a helper column, I have written a GroupSort UDF, as shown below:

By default, GroupSort returns a 2D array, with one column for each group.  Setting the optional “ReturnArray” argument to False returns a single column, with duplicate group names removed.  Full open source code is included in the download file.

Another example using the Sortby function is shown below, to sort a list of names by the second name.  In this case the formula FIND(” “,A48:A71)+1,6) returns an array of the second names, which can be used as the data to sort on, without needing a helper column:


Posted in Excel, UDFs, VBA | Tagged , , , , , | Leave a comment

Lennox Bridge

Last December I joined Bill Harvey on a visit to Lennox Bridge west of Sydney.  Bill has now documented the visit in his Bridge of the Month site, including history, comments on the structural form, and a dynamic 3D model of the structure:

Lennox Bridge is an integral part of Mitchell’s Pass, the old road into the Blue Mountains (I presume through them as well, but I didn’t get that far). It is the oldest surviving stone bridge in mainland Australia (an older one off the mainland is in Richmond, Tasmania, and was opened eight years earlier in 1825

Visit Lennox Bridge for more details, photographs, and view the 3D model at https://skfb.ly/6RZEx .

One of my photos, with Bill constructing his 3D model:


Posted in Arch structures, Historic Bridges, Newton | Tagged , , , , | Leave a comment

The Concrete Institute of Australia – Golden Jubilee

The Concrete Institute of Australia will celebrate 50 years in 2020. The Institute was originally formed when members of the Australia Prestressed Concrete Group proposed a change in 1968 where it was resolved to adopt the name Concrete Institute of Australia. This occurred in May 1969 and the first meeting of Council was then held in July 1969 which was chaired by Mr William (Bill) Brown who was elected as the first National President. Following this the Institute was officially registered as a company limited by guarantee with approved Memorandum and Articles of Association on 17th April 1970.

Posted in Concrete, Newton | Tagged , | Leave a comment