Two more letters

I can’t help feeling that I was a little unfair to Douglas Hofstadter in my last post, so as these were hypothetical letters, I will travel back in time, and send two more, enquiring whether a reductionist or a holistic approach is the better way to approach questions of Life, the Universe and Everything. Here is the text of both hypothetical letters:

Most Excellent Wordsmith,

Holism or reductionism?

Master of the (not (just) an) Excel WordPress-blog

On this occaision I suspect that Douglas Adams would have decided to answer the question in the form of a full length book, called The Trout of Indecision, but being unable to decide whether it should be yet another addition to the Hitchhiker’s Trilogy (with the theme of not being able to see the school for all the fish), or a Dirk Gently story (with the theme that there are interconnections between all things, but some interconnections are much more interesting than others), he would miss deadline after deadline, until sadly and finally being swept up by the final deadline that comes to us all.

Douglas Hofstadter on the other hand would reply promptly with a single two letter word:

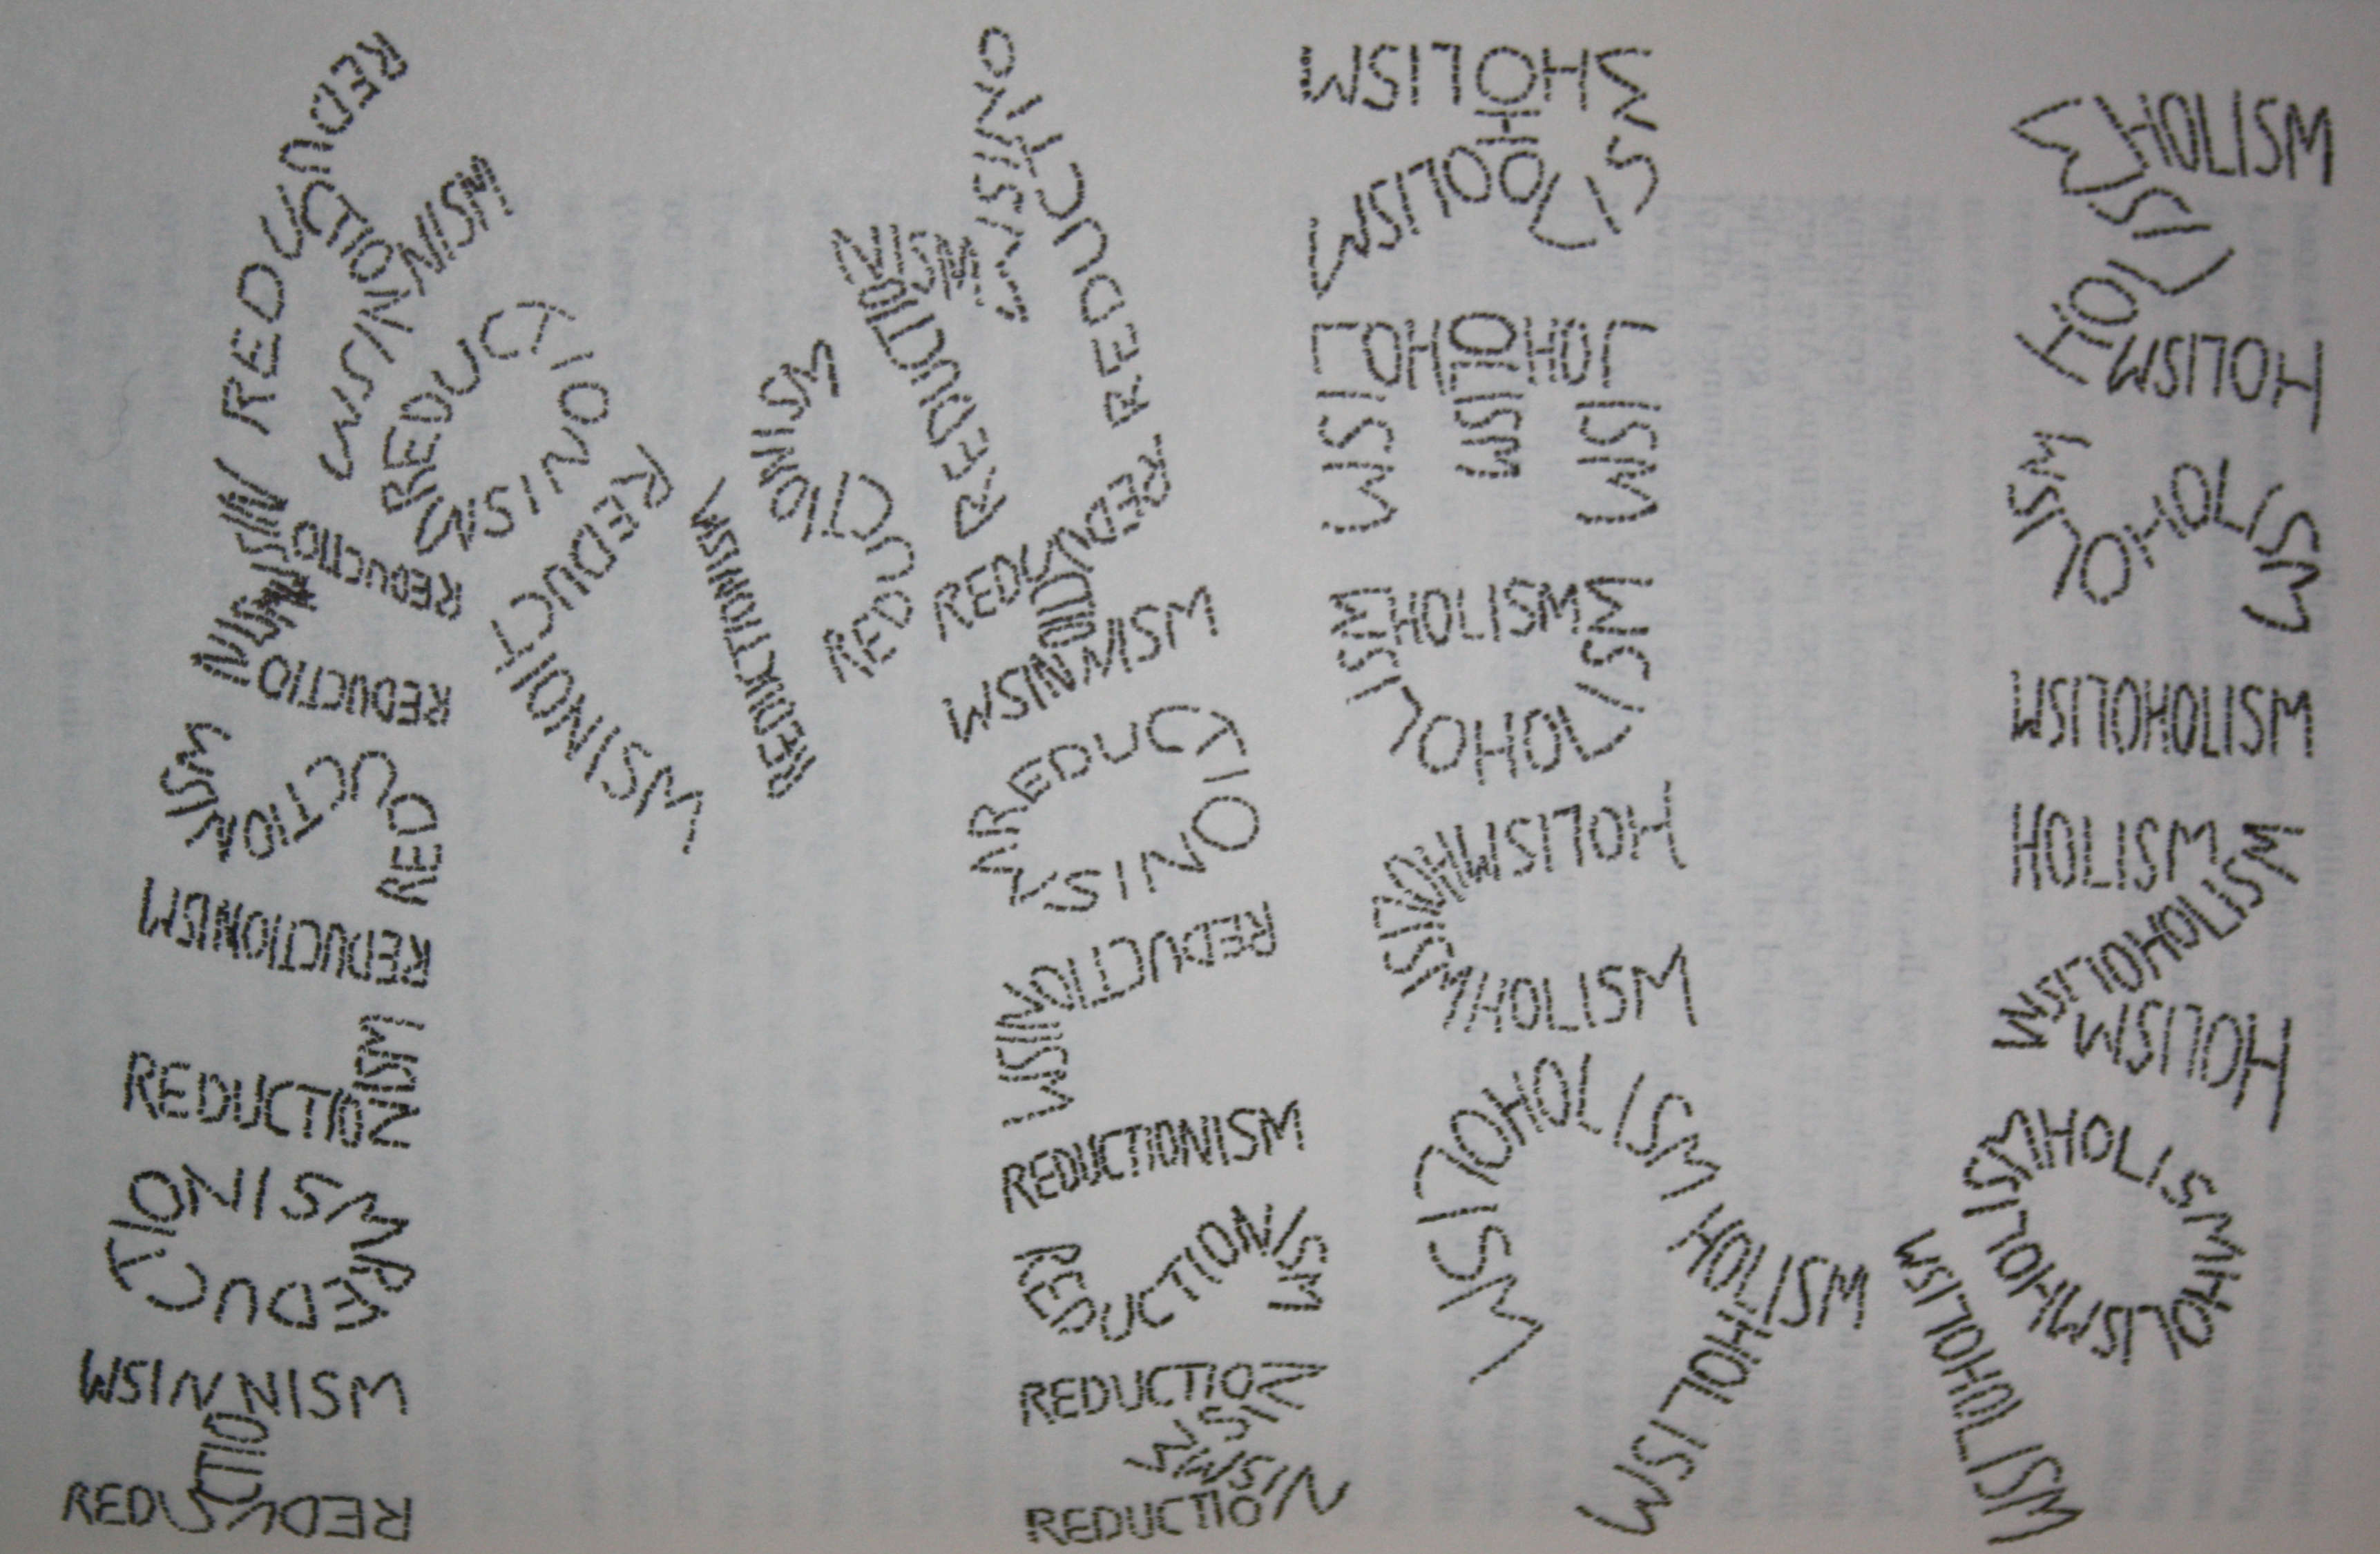
clearly intended to be read three times, the first and last as a phonetic contraction of the TLA, MEW, but what is the meaning of the body of the letter?

Fortunately my imaginary infinite resolution monitor works well on hypothetical documents, and I am able to zoom in on MU, and sharpen it, revealing:

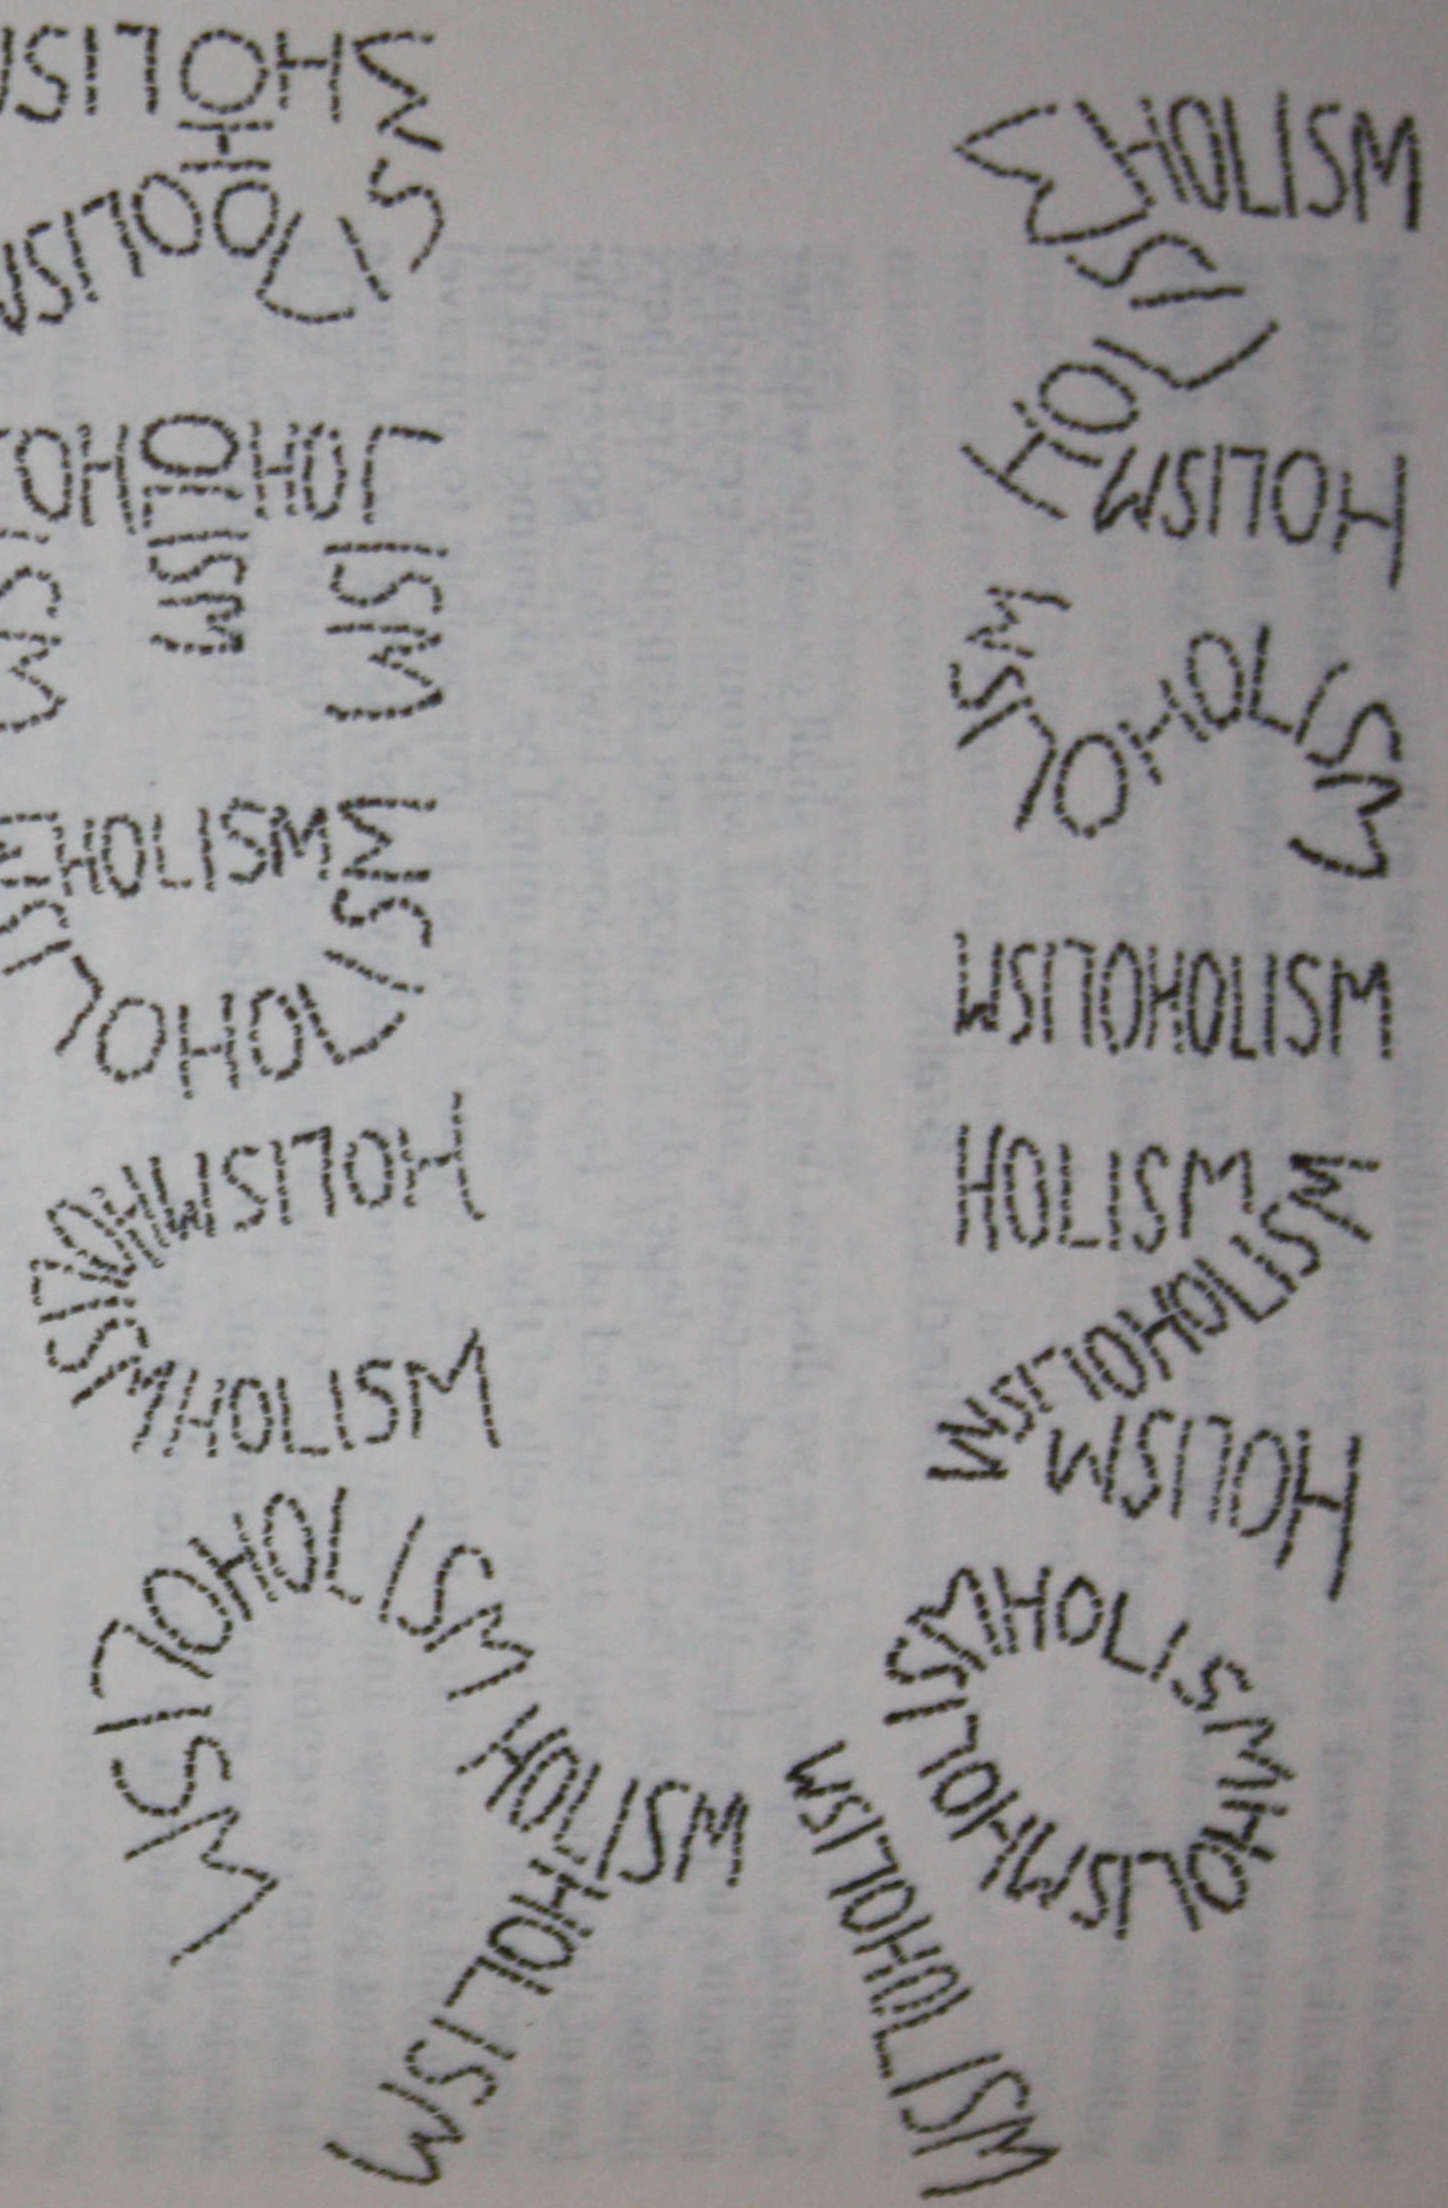
We can now see that the M is made up of three copies of the word “HOLISM”, and the U by the word “REDUCTIONISM”, and if we zoom still further, we see that:

each letter of “HOLISM” is made up of the word “REDUCTIONISM”, and that:

each letter of reductionism is made up of the word “HOLISM”.  And if we zoom still further we see that:

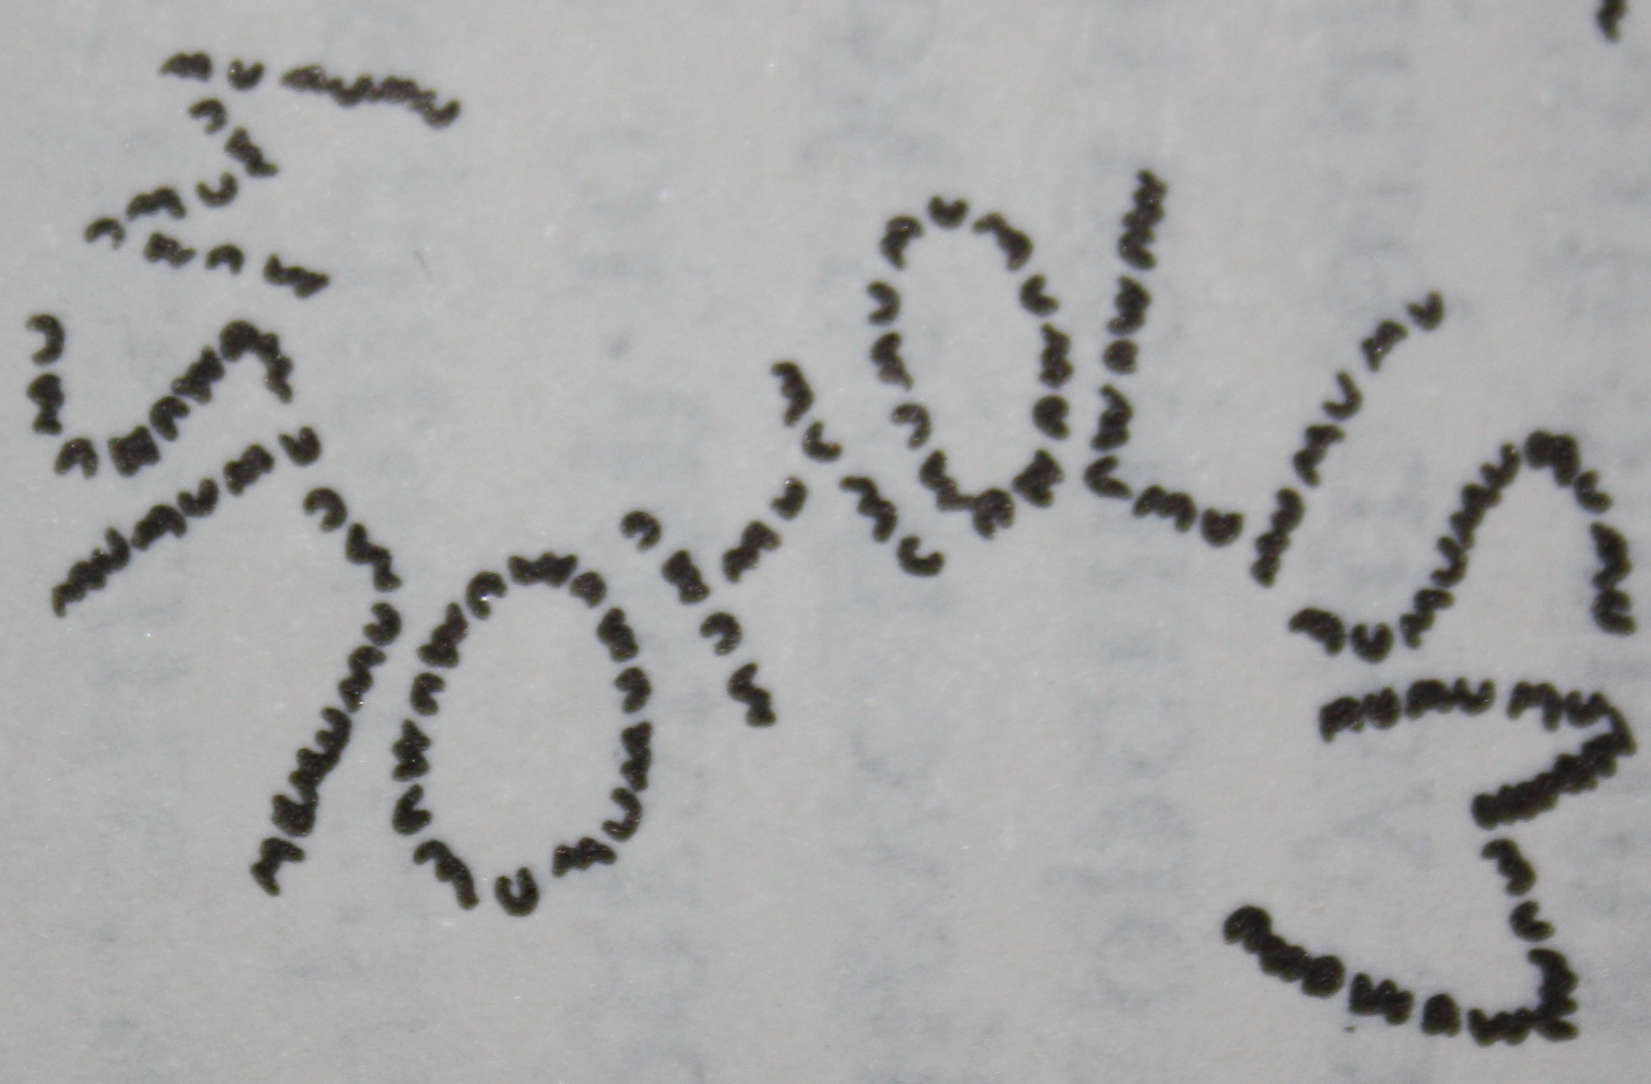
each letter of the smaller words is made up of multiple copies of the word:

…  and so on.

All images in this post are based on the original from Douglas Hofstadter’s “Godel, Escher Bach”

Some nice links about Godel, Escher, Bach, and Godel, Escher, Bach can be found at: Godel, Escher, Bach

Posted in Newton | Tagged , , , , , , | 2 Comments

A Tail of Two Letters …

… or the importance of being Douglas.

I’m currently reading Douglas Hofstadter’s “I am a Strange Loop”, which has reminded me of two hypothetical imaginary letters that I never sent (and now never will) to Mr Hofstadter and Douglas Adams.

The letters were identical, and were enquiring whether the reader was aware of the importance of brevity in all manner of written literary endeavours. Here is the text:

Doug,

Dig it?

Doug

If he had the time and inclination to accept the brief, I feel sure that Douglas Hofstadter would respond with a lengthy treatise, full of witty self referential references to all manner of brief entities, which would alternately delight and mystfy, explaining that yes, he was aware of, and always practiced at length, the art of being brief.

Douglas Adams’ hypothetical response would have been a little shorter, and I have reproduced it in full below:

Dug!

This is to be read three times, salutation, body, and signature, all in one three letter word.

Read it again and it is documentary evidence that what the author says is true; surely the World’s shortest quality document, complying with ISO 9001.

Posted in Newton | Tagged , , , | 1 Comment

Fitting high order polynomials

This post is a follow up to Using LINEST for non-linear curve fitting and the following comments from Scott Rogers and Lori Miller.  Scott found that he was getting different results from Linest and the xy chart trend line for polynomials of order 5 and 6 (6th order being the highest that can be displayed with the trend line).

In order to investigate this I have looked at fitting polynomials of different degree to the function y = 1/(x – 4.99) over the range x = 5 to x = 6.  It should be emphasised that high order polynomials are completely inappropriate for interpolating a function such as this; it was chosen purely because it shows up the differences in the results from the four different methods examined.  These were:

  1. Using the LINEST function: =LINEST(YRange, XRange^{1,2, … ,n}
  2. Using the xy chart trend line for polynomials up to 6th order
  3. Using the function provided by Lori Miller in the comments: =MMULT(MMULT(TRANSPOSE(Y),X^N),MINVERSE(MMULT(TRANSPOSE(X^N),X^N)))
  4. Using the ALGLIB “PolynomialFit” fit routine.  This is specifically intended to fit a polynomial to scattered data, using a least squares method.  I have written an Excel VBA User Defined Function (UDF) to call the ALGLIB function directly from the spreadsheet.  I will post more details of this, including a download file with open source code, in a future post.

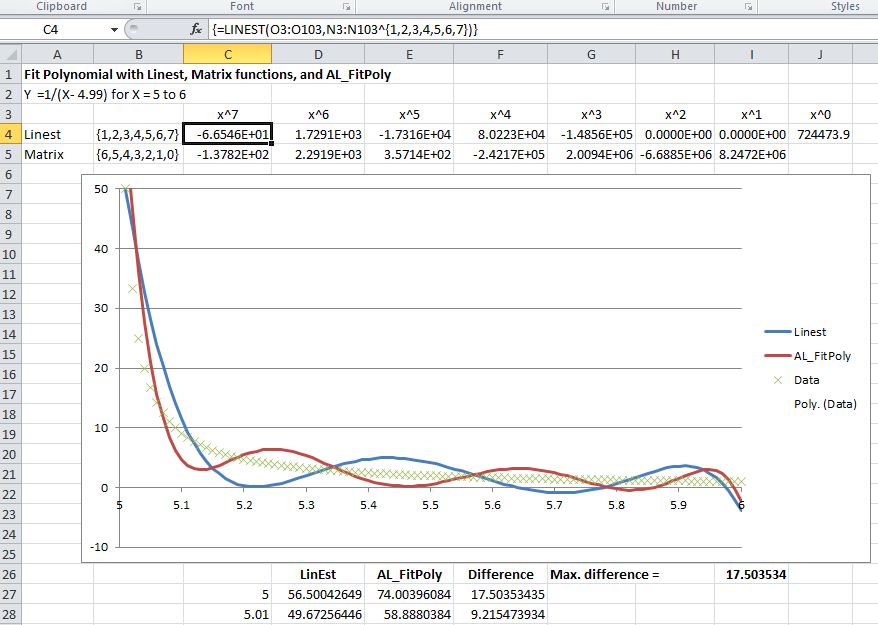
The screenshots below show the following results for polynomials fitted to the test function:

  • Plots of the base data for 101 points between x = 5 and x = 6, and the four generated polynomial curves.
  • The polynomial coefficients for the Linest curve, the chart trend line (displayed on the charts), and the matrix function.
  • Unfortunately the current VBA version of the ALGLIB routine does not return the polynomial coefficients (this feature should be available in a few months), so I have evaluated the Linest and the Alglib functions at each of the base data x values, and found the maximum absolute difference between the two.


For 4th order polynomials:
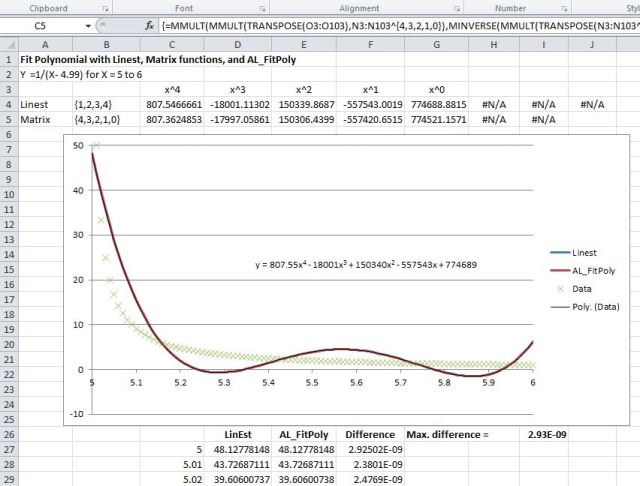
4th order polynomial, click for full size view

the Linest, chart trend line and ALGLIB results are essentially identical, but the matrix function is already showing significant differences.

For 5th order polynomials:

5th order polynomials

the Linest, chart trend line, and ALGLIB results are still in good agreement, but the matrix function results are now completely different.

For 6th order:
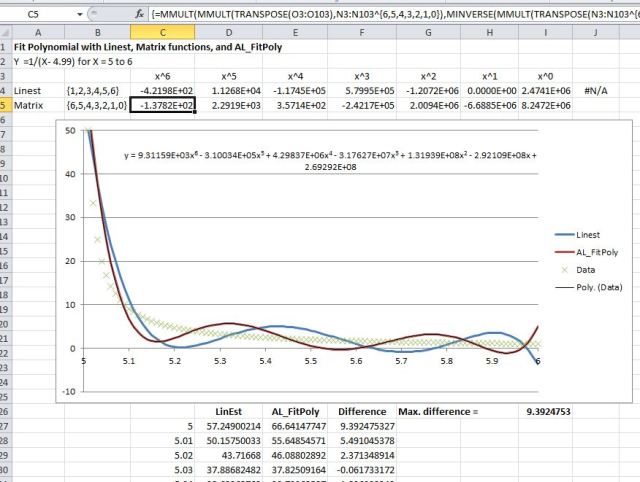
6th order polynomials

The Linest and chart trend line results are now completely different, with Linest having returned a coefficient of 0 for the x term.  The ALGLIB results appear visually identical to the chart trend line.

For the 7th order only the Linest and ALGLIB results are plotted:
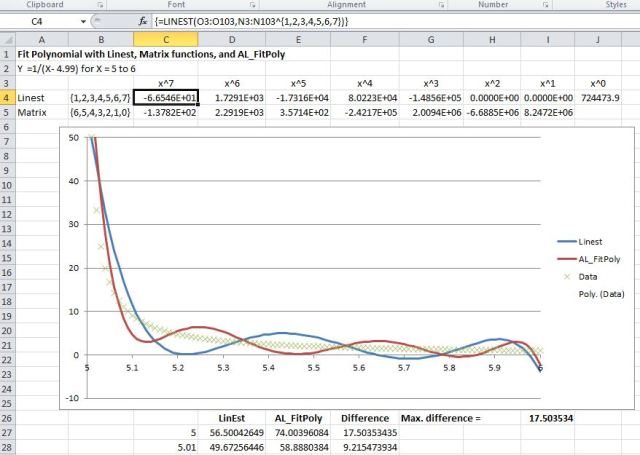
7th order polynomials

The Linest line has retained a form similar to the 5th order results (with zero coefficients for the x squared and x terms), but the ALGLIB line is consistent with a 7th order polynomial.

It can be seen that in all cases the polynomial lines oscillate above and below the data, which is a feature of fitting high order polynomials to a monotonic function.  To check if the behaviour of the Linest output was a result of fitting a polynomial function to inappropriate data the same exercise was carried out on a cyclic function:

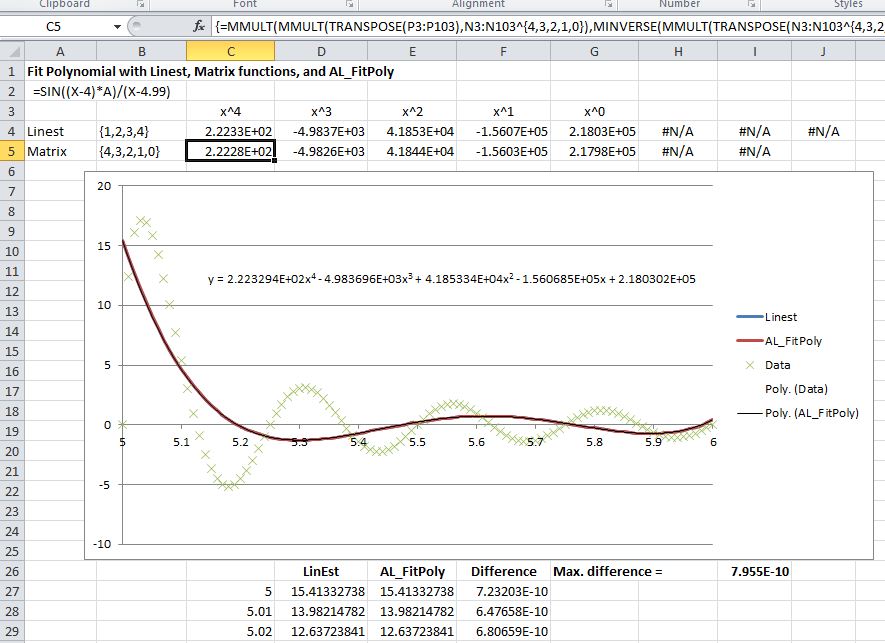
y = =SIN((X-4)*A)/(X-4.99), with A set to 8pi, so that the resulting function had 4 complete cycles over the range from x = 5 to x = 6.

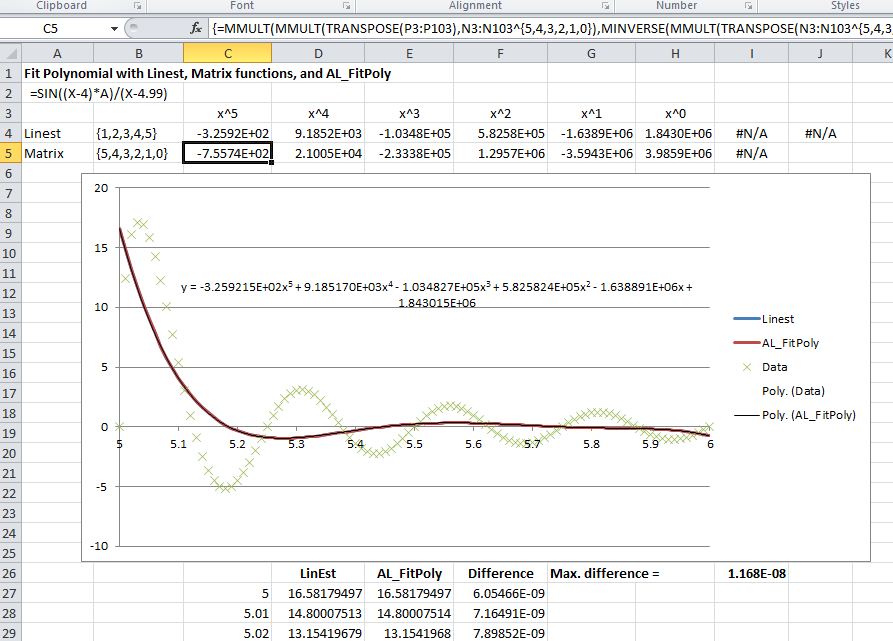
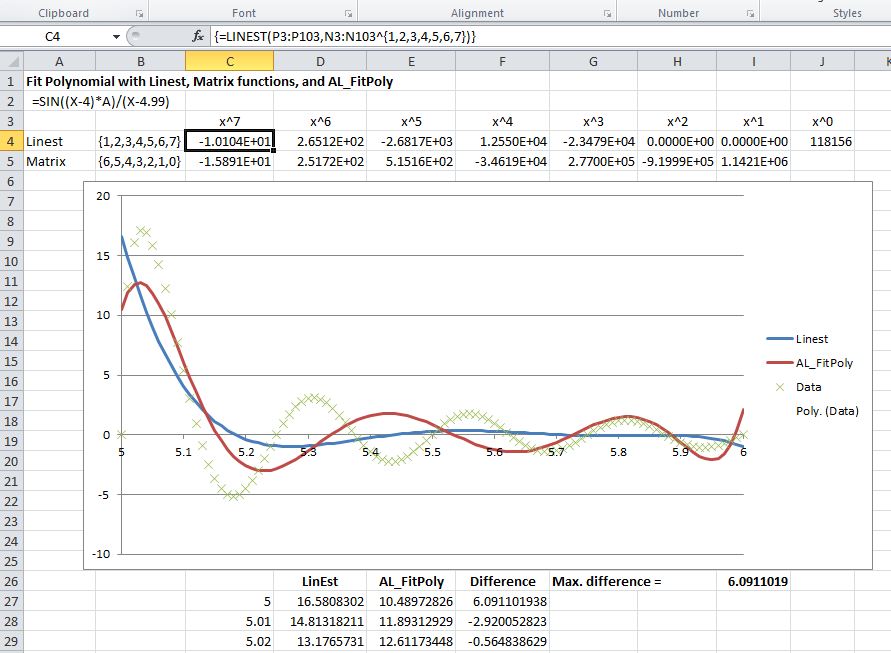
The results for fourth order to seventh order polynomials are shown in the four screen shots below:

Cyclic function, fourth order polynomials

Cyclic function; fith order polynomials

Cyclic function; 6th order polynomials
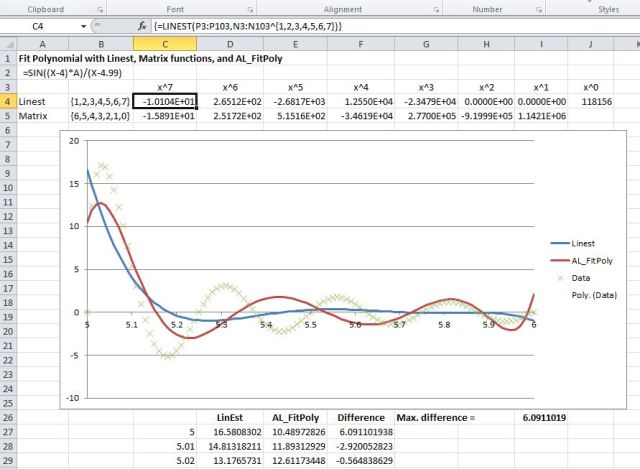
Cyclic function; 7th order polynomials

The results were very similar to those for the monotonic function, with the Linest results being different from the chart trend line at the 6th order, and with the x squared and x coefficients from Linest being zero for the 7th order line.

Two further lines were plotted with 10th order polynomials (Linest and ALGLIB) and 15th order (ALGLIB only), to check if a reasonably close fit to the data could be found:

Cyclic function, 10th order polynomials

Cyclic function, 15th order polynomial

It can be seen that the 10th order Linest line has maintained the form of the 5th order polynomial, with 5 of the 11 coefficients being set to zero.  The ALGLIB results appear to be appropriate to the order of the polynomial curve, and a good fit has been achieved to the data with a 15th order polynomial.

In conclusion:

  • The Excel Linest function and polynomial chart trendline produce different results for 6th order polynomials in the cases examined.  As noted by Lori Miller in the comments to the previous Linest post, this is probably because of changes made to the algorithm for dealing with co-linear data.
  • The matrix function (at least in this case) did not give good results beyond fourth order.
  • For most interpolation purposes use of a cubic spline will normally give better results than a high order polynomial.
  • For cases where a high order polynomial is appropriate the ALGLIB PolynomialFit routine appeared to give much better results than Linest.  In separate tests PolynomialFit was found to be stable up to at least 50th order, with the data presented here.
Posted in AlgLib, Charts, Excel, Maths, Newton, UDFs, VBA | Tagged , , , , , , , , | 31 Comments

Seeing through Mingus eyes

At the top of Bob Phillips’ Blog home page is a quote from Charles Mingus, the great jazz bassist, band leader and composer:

“Making the simple complicated is commonplace; making the complicated simple, awesomely simple, that’s creativity”

If Bob hadn’t bagged it already, that would make an excellent statement of the common theme connecting the intertwined topics of this blog, whether it be:

all share the attribute of making the complex simple.

Now all of this was probably the last thing that Richard Thompson had in mind, when he wrote his song Mingus Eyes, but since he tells his story in only 35 different words (count them):

it all fits anyway.

And finally, let’s hear from the man himself, Charles Mingus playing Haitian Fight Song (edit 4th May 2011, the Mingus link got cut, so here is the Mingus Big Band playing the same composition in 2001):

What do you think?  What are your favourite examples of making the complex simple?

Posted in Bach, Computing - general, Newton | Tagged , , , | Leave a comment

New Links

Two new Excel links on the list to the right, both with a tonne of good information on how to get more out of Excel:

Bob Phillips writes the Excel Do, Dynamic Does blog, with a focus on business information.  The quote under his header line will feature in my next post here (real soon now).

Ron de Bruin’s site is not a blog, but it is regularly updated, and is full of good stuff that you won’t find elsewhere.

Finally a new bridge link: Bill Harvey’s site is called arches, and that’s what it’s all about, specifically masonry arch bridges, and the analysis thereof, to see if they will collapse under loadings many times greater than those they were designed for.  Those interested can also sign up for Bill’s Bridge of the Month Newsletter at http://eepurl.com/ccAyL

Posted in Arch structures, Excel, Historic Bridges, Newton | Tagged , , | Leave a comment