The new version fixes a problem with the MomcurveTS function, which was returning an error for any input strain greater than 0.0005. An example of the updated function is shown in the screenshot below:
The certificate problem has now been fixed, and most download links should now work without a problem. Note that any file with VBA code (which is almost all of them) will have the VBA blocked with no obvious unblock option. The procedure to unblock the code is actually quite straightforward and is detailed at: https://newtonexcelbach.com/2023/04/28/two-views-on-vba/.
If there are any remaining problems, please let me know with a comment.
Original post:
It seems there is a problem with the certificate for my downloads folder, which generates security warnings if anyone tries to download anything. I am working on fixing that, but in the meantime the link below should allow download of any of the files posted here:
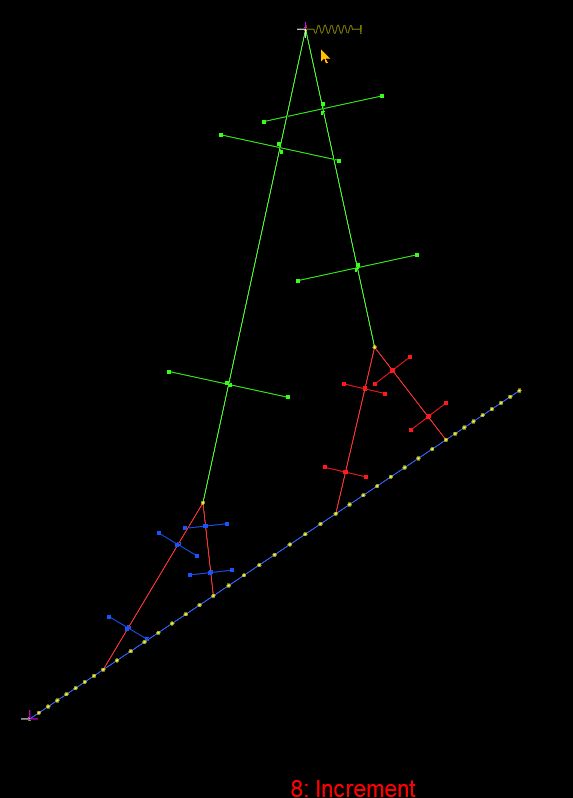
The problem involves the lifting of a precast concrete panel (or any other long thin object) with lifting points at four sections along the length of the panel, and with the load connected to the crane hook through 3 slings with 3 pulleys:
The spreadsheet 4PointLift.xlsb has been added to the py_SciPy download, along with two new Python functions added to the pyScipy3.py file. The updated files can be downloaded from:
The spreadsheet uses the pyxll add-in to call Python code from Excel. See pyxll for more details and download.
Assumptions in the analysis are:
The pulleys have negligible friction.
The crane lifting force at the top pulley is vertical.
The panel rotates about the left end of the panel, which does not move horizontally.
Bending deflections of the panel and axial deflections of the panel and slings are negligible.
With these assumptions it can be shown that:
The legs of the top sling must have equal and opposite angles to vertical.
Each leg of the top sling bisects the angle at the top of the attached lower slings.
The total length of each sling is unchanged.
The required input data is:
The length along the panel to each lifting point, measured from the left; L1 to L4 in the diagram above. L5 is only required for plotting the lift diagram.
The three sling lengths.
The angle of the panel to horizontal.
Guessed coordinates for the 3 pulley positions, with origin at the left end of the panel.
With this data the XY coordinates of the 4 lifting points can be calculated:
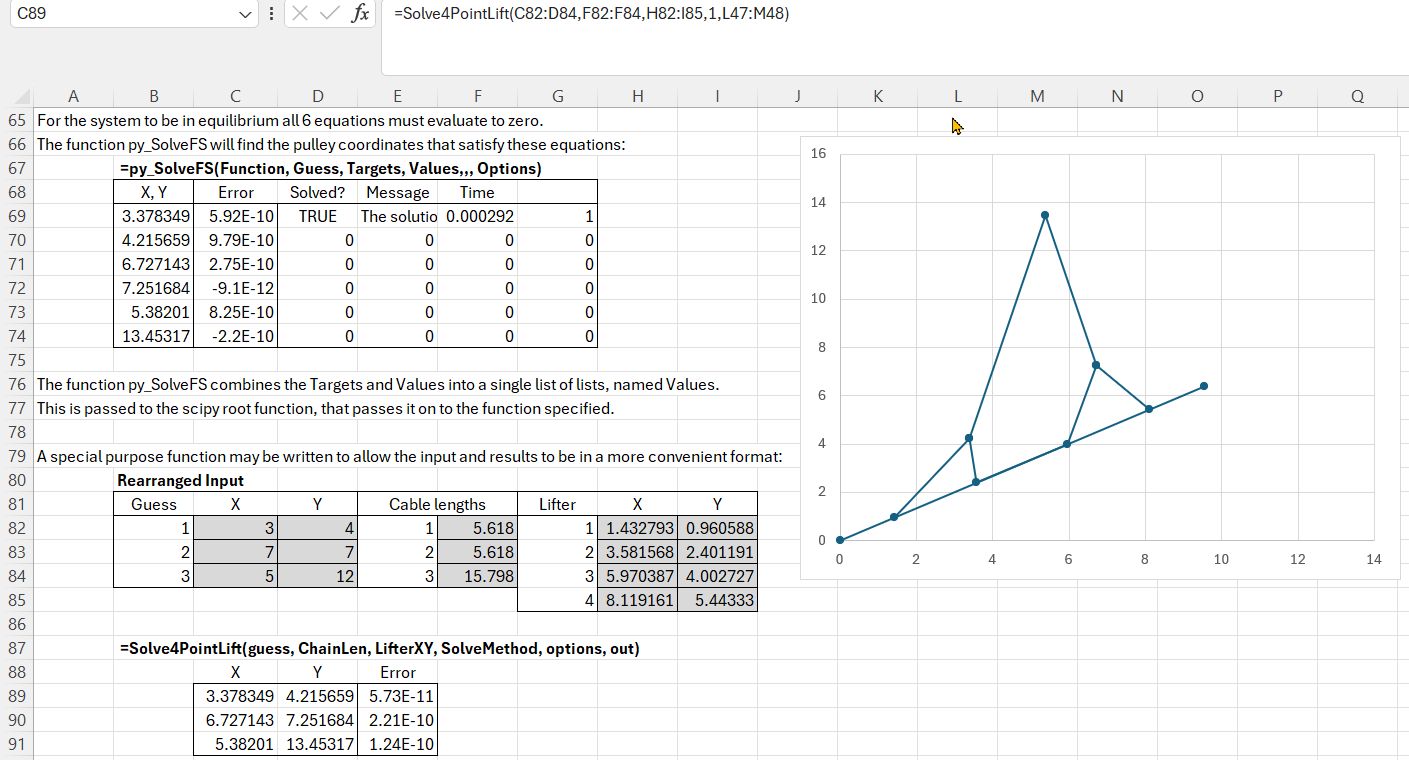
The problem can be solved using the general purpose solver function py_SolveFS, together with the LiftCoords function. To use py_SolveFS the input must be rearranged to single column ranges, as shown above.
The function LiftCoords evaluates the six equations shown below.
py_SolveFS combines the Targets and Values arrays into a single list of lists which it passes to the Scipy root function, that passes the data onto LiftCoords, together with adjusted “Guess” data, until all the returned values are sufficiently close to zero.
def LiftCoords(x0, values):
    Target = values[0]
    knownvals = values[1]

    a, b, c, d, e, f, g, h = knownvals
    o, p, q = Target

    i, j, k, l, m, n = x0


    res = np.zeros(6)

    res[0] = ((((i-a)**2)+((j-b)**2))**0.5)+((((c-i)**2)+((j-d)**2))**0.5)-o
    res[1] = ((((k-e)**2)+((l-f)**2))**0.5)+((((g-k)**2)+((l-h)**2))**0.5)-p
    res[2] = ((((m-i)**2)+((n-j)**2))**0.5)+((((k-m)**2)+((n-l)**2))**0.5)-q
    res[3] = (m-i)/(n-j)-(k-m)/(n-l)
    res[4] = (2*(np.arctan2((n-j),(m-i)))-np.arctan2((j-b),(i-a))-np.arctan2((j-d),(i-c)))
    res[5] = (2*(np.arctan2((n-l),(m-k)))-np.arctan2((l-f),(k-e))-np.arctan2((l-h),(k-g)))

    return res
After root finds the solution to the 6 equations py_SolveFS returns the final 6 values (the XY coordinates of the 3 pulley locations) to the spreadsheet, together with estimated errors and solution time.
As an alternative to using py_SolveFS, I have written a problem specific function to allow the input and results to be in a more convenient format. Input and output for Solve4PointLift are shown above.
The results from the spreadsheet analysis shown above were checked using the Strand7 FEA program. After increasing the stiffness of the concrete and slings by a factor of 100, the Strand7 results were found to be within 0.25 mm of the spreadsheet solver results:
This post features code using the pyxll add-in to call Python code from Excel. See pyxll for more details and downlod.
A recent issue of New Scientist had a series of puzzles finishing with: how many integers between 1 and 1 million have the property that 1/3 of their factors are divisible by 3.
This can actually be solved without factorising 1 million numbers, which is the point of the puzzle, but it is an interesting exercise to write the code to do it the brute force way in a reasonable time.
First a function to list all the factors of any input integer:
def py_factors1(n):
    factlist = reduce(list.__add__, ([i, n//i] for i in range(1, int(n**0.5) + 1) if n % i == 0))
    return list(set(factlist))
Then count the total number of factors, and that number that are exactly divisible by an input value:
def py_countfact1(factlist, n):
    numfact = len(factlist)
    numdiv = 0
    for i in range(0, numfact):
        if factlist[i] % n == 0: numdiv = numdiv+1
    return(numfact, numdiv)
Then call each function over the given range, and count the number that satisfy the required factor ratio.:
The New Scientist puzzle is solved by this code in about 9 seconds, finding that there are no numbers satisfying the required factor ratio:
The solution time can be greatly reduced with the Numba just-in-time compiler. For the second function it is only necessary to add the Numba decorator at the top of the code. I have also added pyxll decorators, so it can be called from Excel:
@xl_func
@xl_arg('factlist', 'int[]')
@xl_arg('n', 'int')
@njit
def py_countfact(factlist, n):
    numfact = len(factlist)
    numdiv = 0
    for i in range(0, numfact):
        if factlist[i] % n == 0: numdiv = numdiv+1
    return(numfact, numdiv)
The first function is not so simple. Numba does not work with set objects, or the reduce function, so it must be re-written:
@xl_func
@xl_arg('n', 'int')
@njit
def py_factors(n):
    maxn = int(n**0.5) + 1
    factlist = [1]
    for i in range(2, maxn):
        if n % i == 0:
            if not i in factlist:
                factlist.append(i)
                if i != n//i: factlist.append(n//i)
    factlist.append(n)
    return factlist
The calling function only requires the Numba decorator, and editing to call the new functions:
The new code reduces the execution time to 0.47 seconds:
The functions can be called from Excel with any desired range, divisor and target ratio:
I have added the functions described above and the associated code to the pyxll examples.xlsx and worksheetfuncs.py files, which can be downloaded from: FactorUDFs.zip
The calculation of the effective depth for longitudinal force due to shear has been updated to be consistent with the Australian code requirements.
An example of the py_UMomR function has been added to the py_UMom spreadsheet.
The py_UMomR function has the same simplified input as py_UMom, specifying a rectangular section with 2 layers of reinforcement, with the addition of an optional range for prestress details. This allows a prestress force to be applied to one or both layers of reinforcement, and/or an additional prestressed tendon to be specified.